Single-Cell Data Model
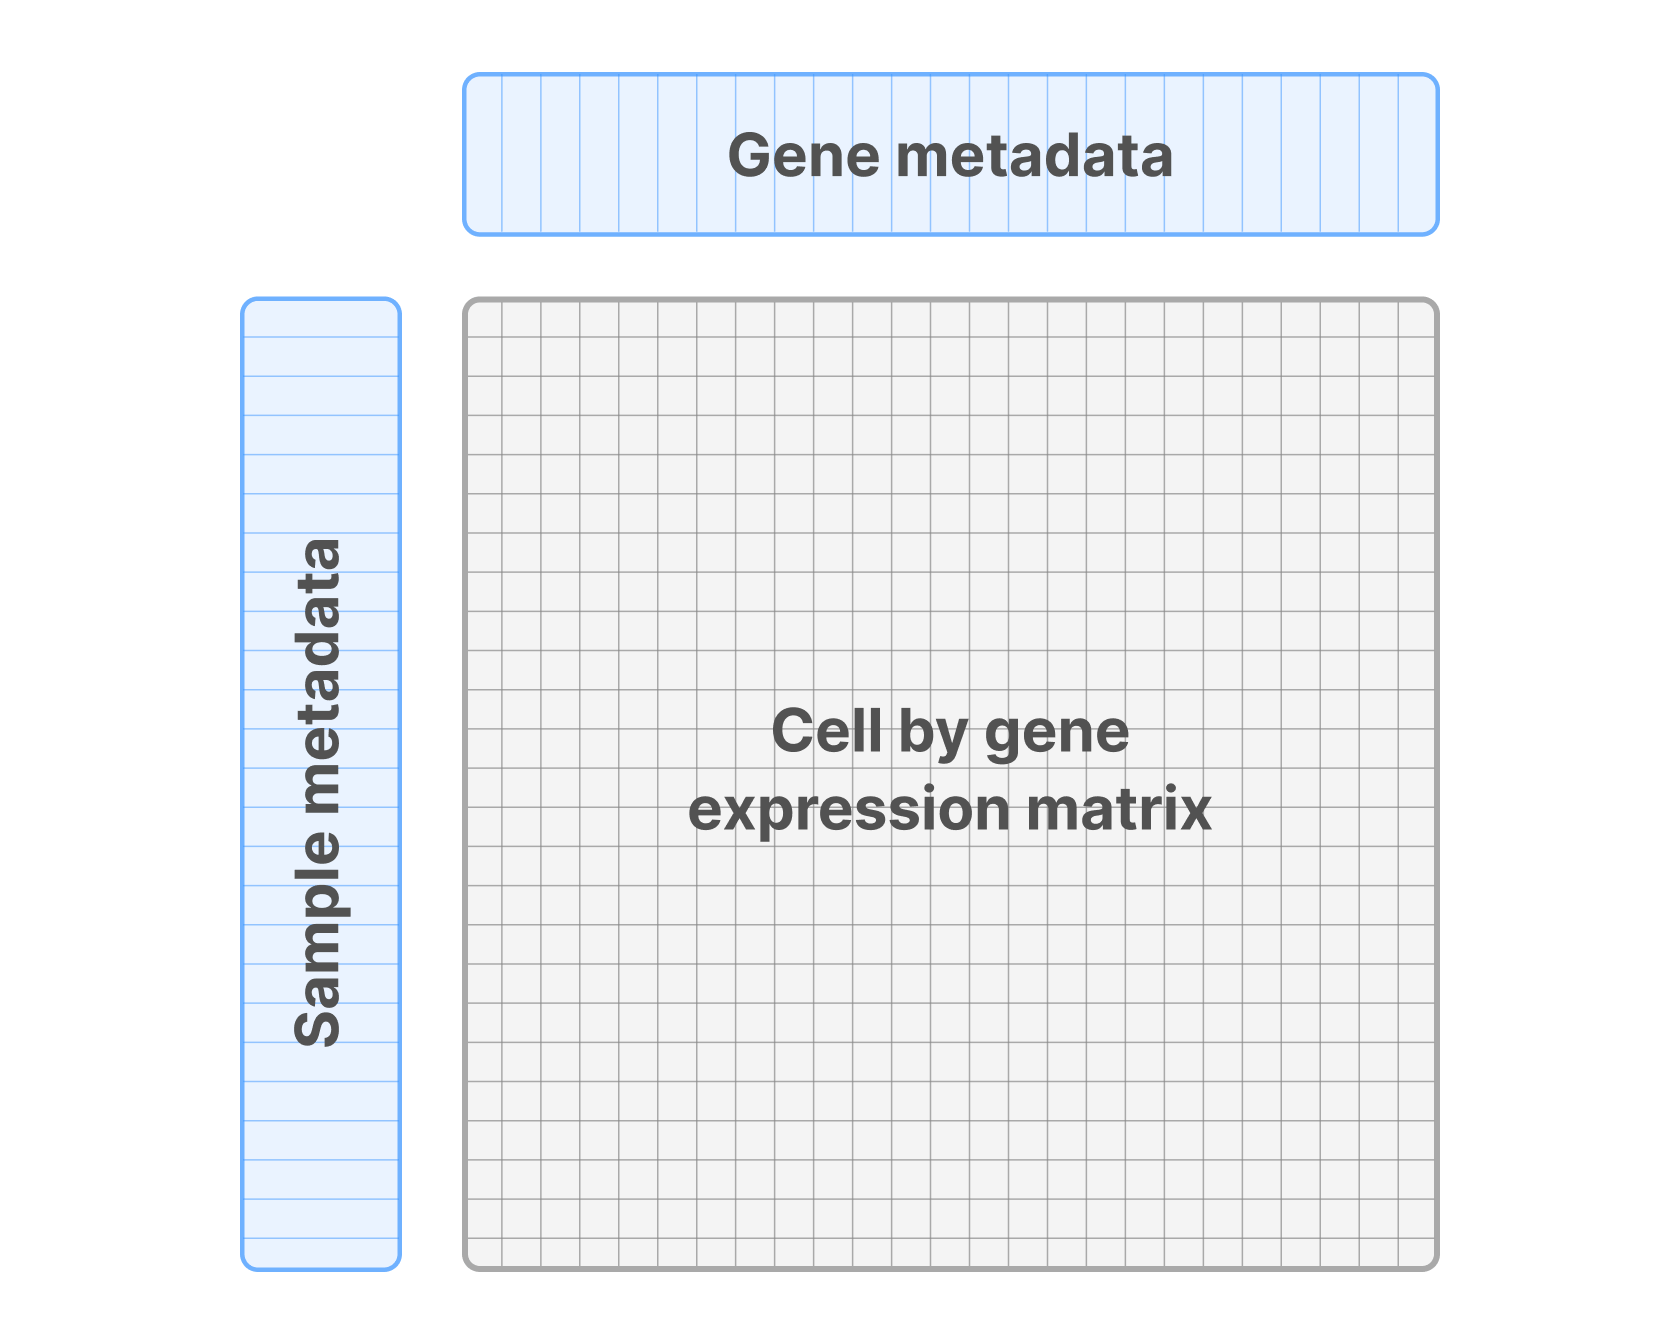
Before diving into SOMA’s data model, it is important to understand the structure at the core of single-cell datasets: the annotated matrix. This structure provides a natural representation for the key elements of any multiplexed assay in which multiple measurements are collected across a set of samples. For example, the output from a single-cell RNA-seq (snRNA-seq) experiment would include, at minimum:
- Expression matrix: Each row corresponds to a single cell and each column to a gene. The value in a particular cell of this matrix represents the expression level of a gene in a specific cell.
- Cell annotations: Alongside the expression matrix, you have a table containing metadata annotations for each cell (rows in the expression matrix). This typically includes sample identifiers, experimental conditions, and other information that provides context for the expression levels. These annotations facilitate grouping, filtering, or other analyses on subsets of cells.
- Gene annotations: Similar to cell annotations, you have another table that provides metadata for each gene (columns in the expression matrix). These annotations might include gene IDs, gene names, or functional categories, providing a reference point for interpreting the expression levels and performing downstream analyses like pathway enrichment.
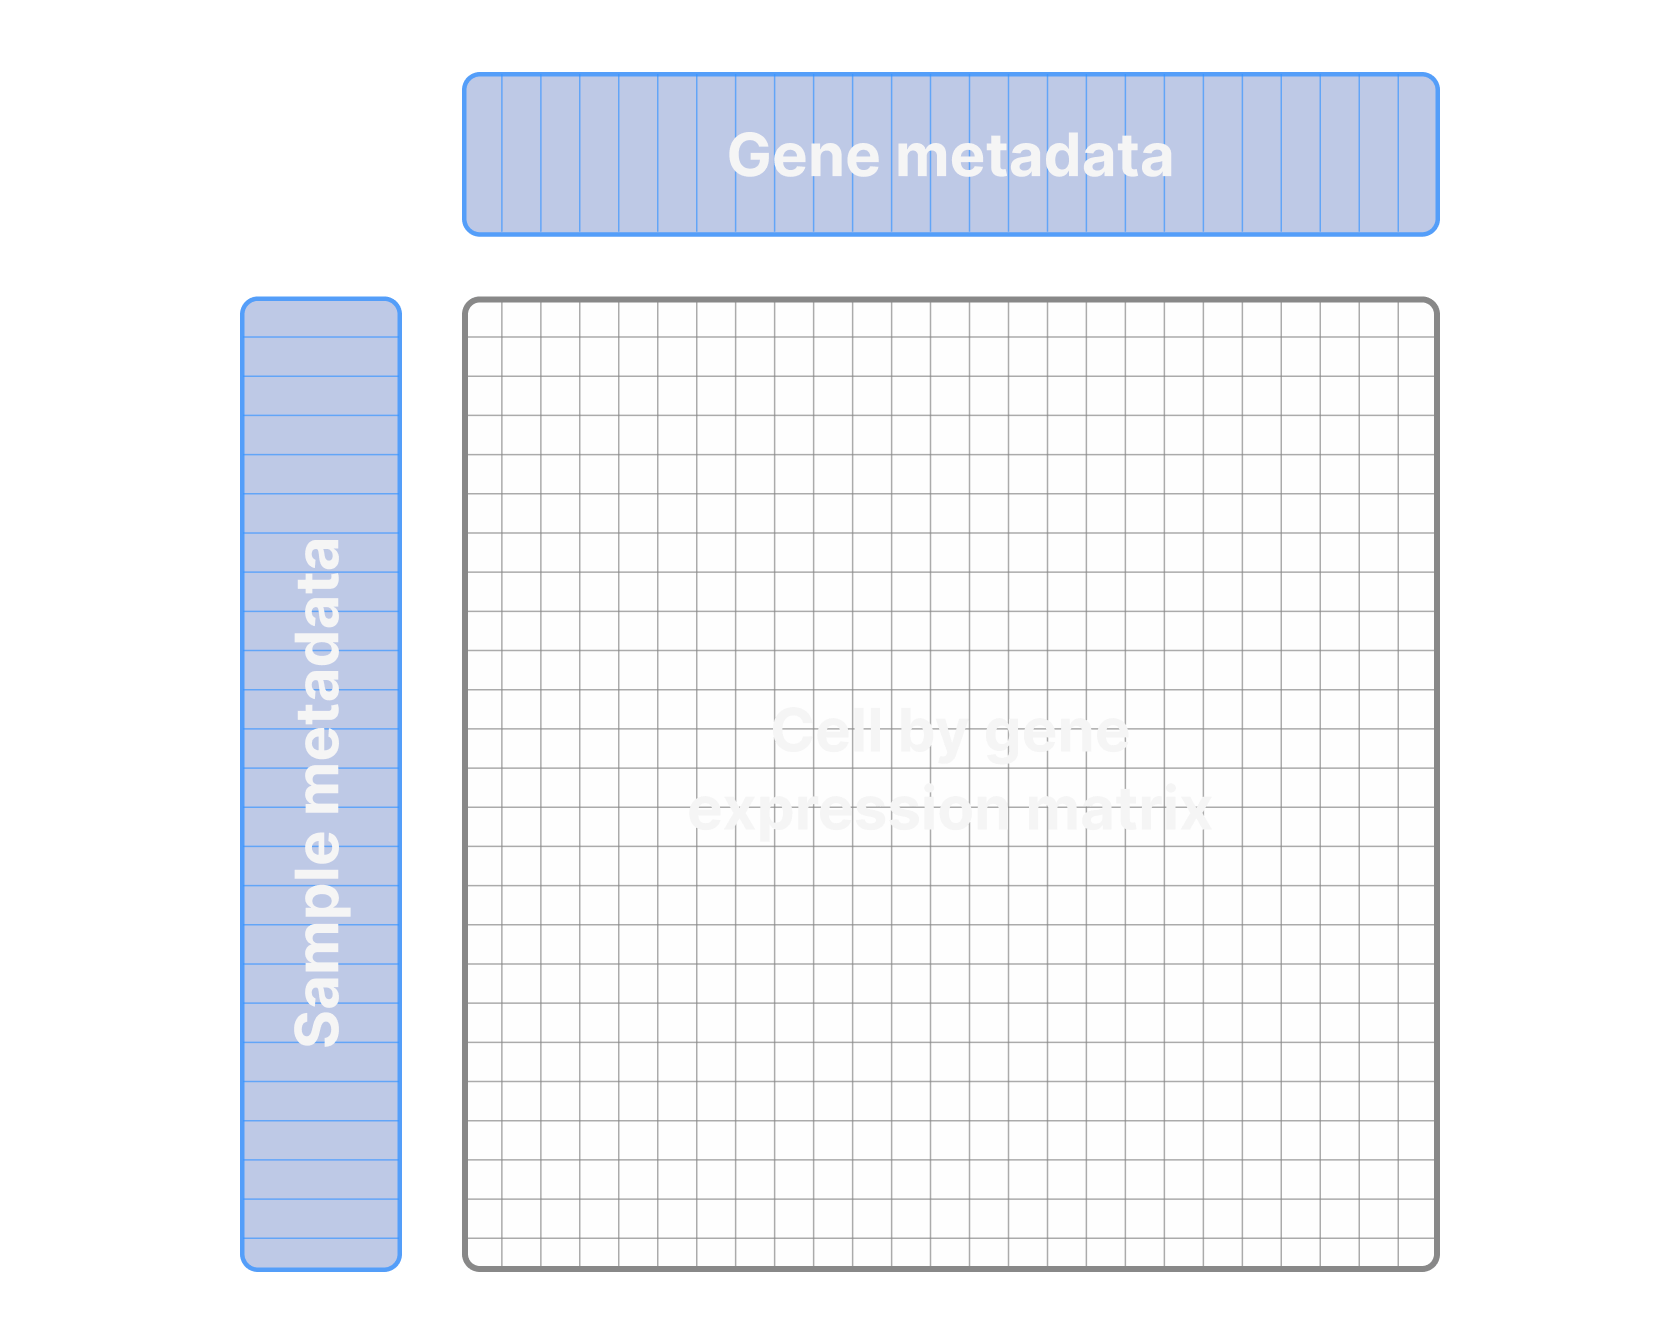
These three elements are then combined into a single annotated matrix, that can be represented as follows:
This encapsulation has a long history in computational biology. Over 20 years ago, the Bioconductor project added a specialized exprSet class to its Biobase R package to represent annotated matrices containing microarray data. This pioneering work made it possible to store and manipulate complex biological data in a simple, intuitive structure, allowing researchers to easily query expression data based on sample or feature annotations, now standard in most omics toolkits. It also laid the foundation for data structures utilized by modern single-cell analysis libraries like Seurat, AnnData, and Bioconductor’s own SingleCellExperiment.
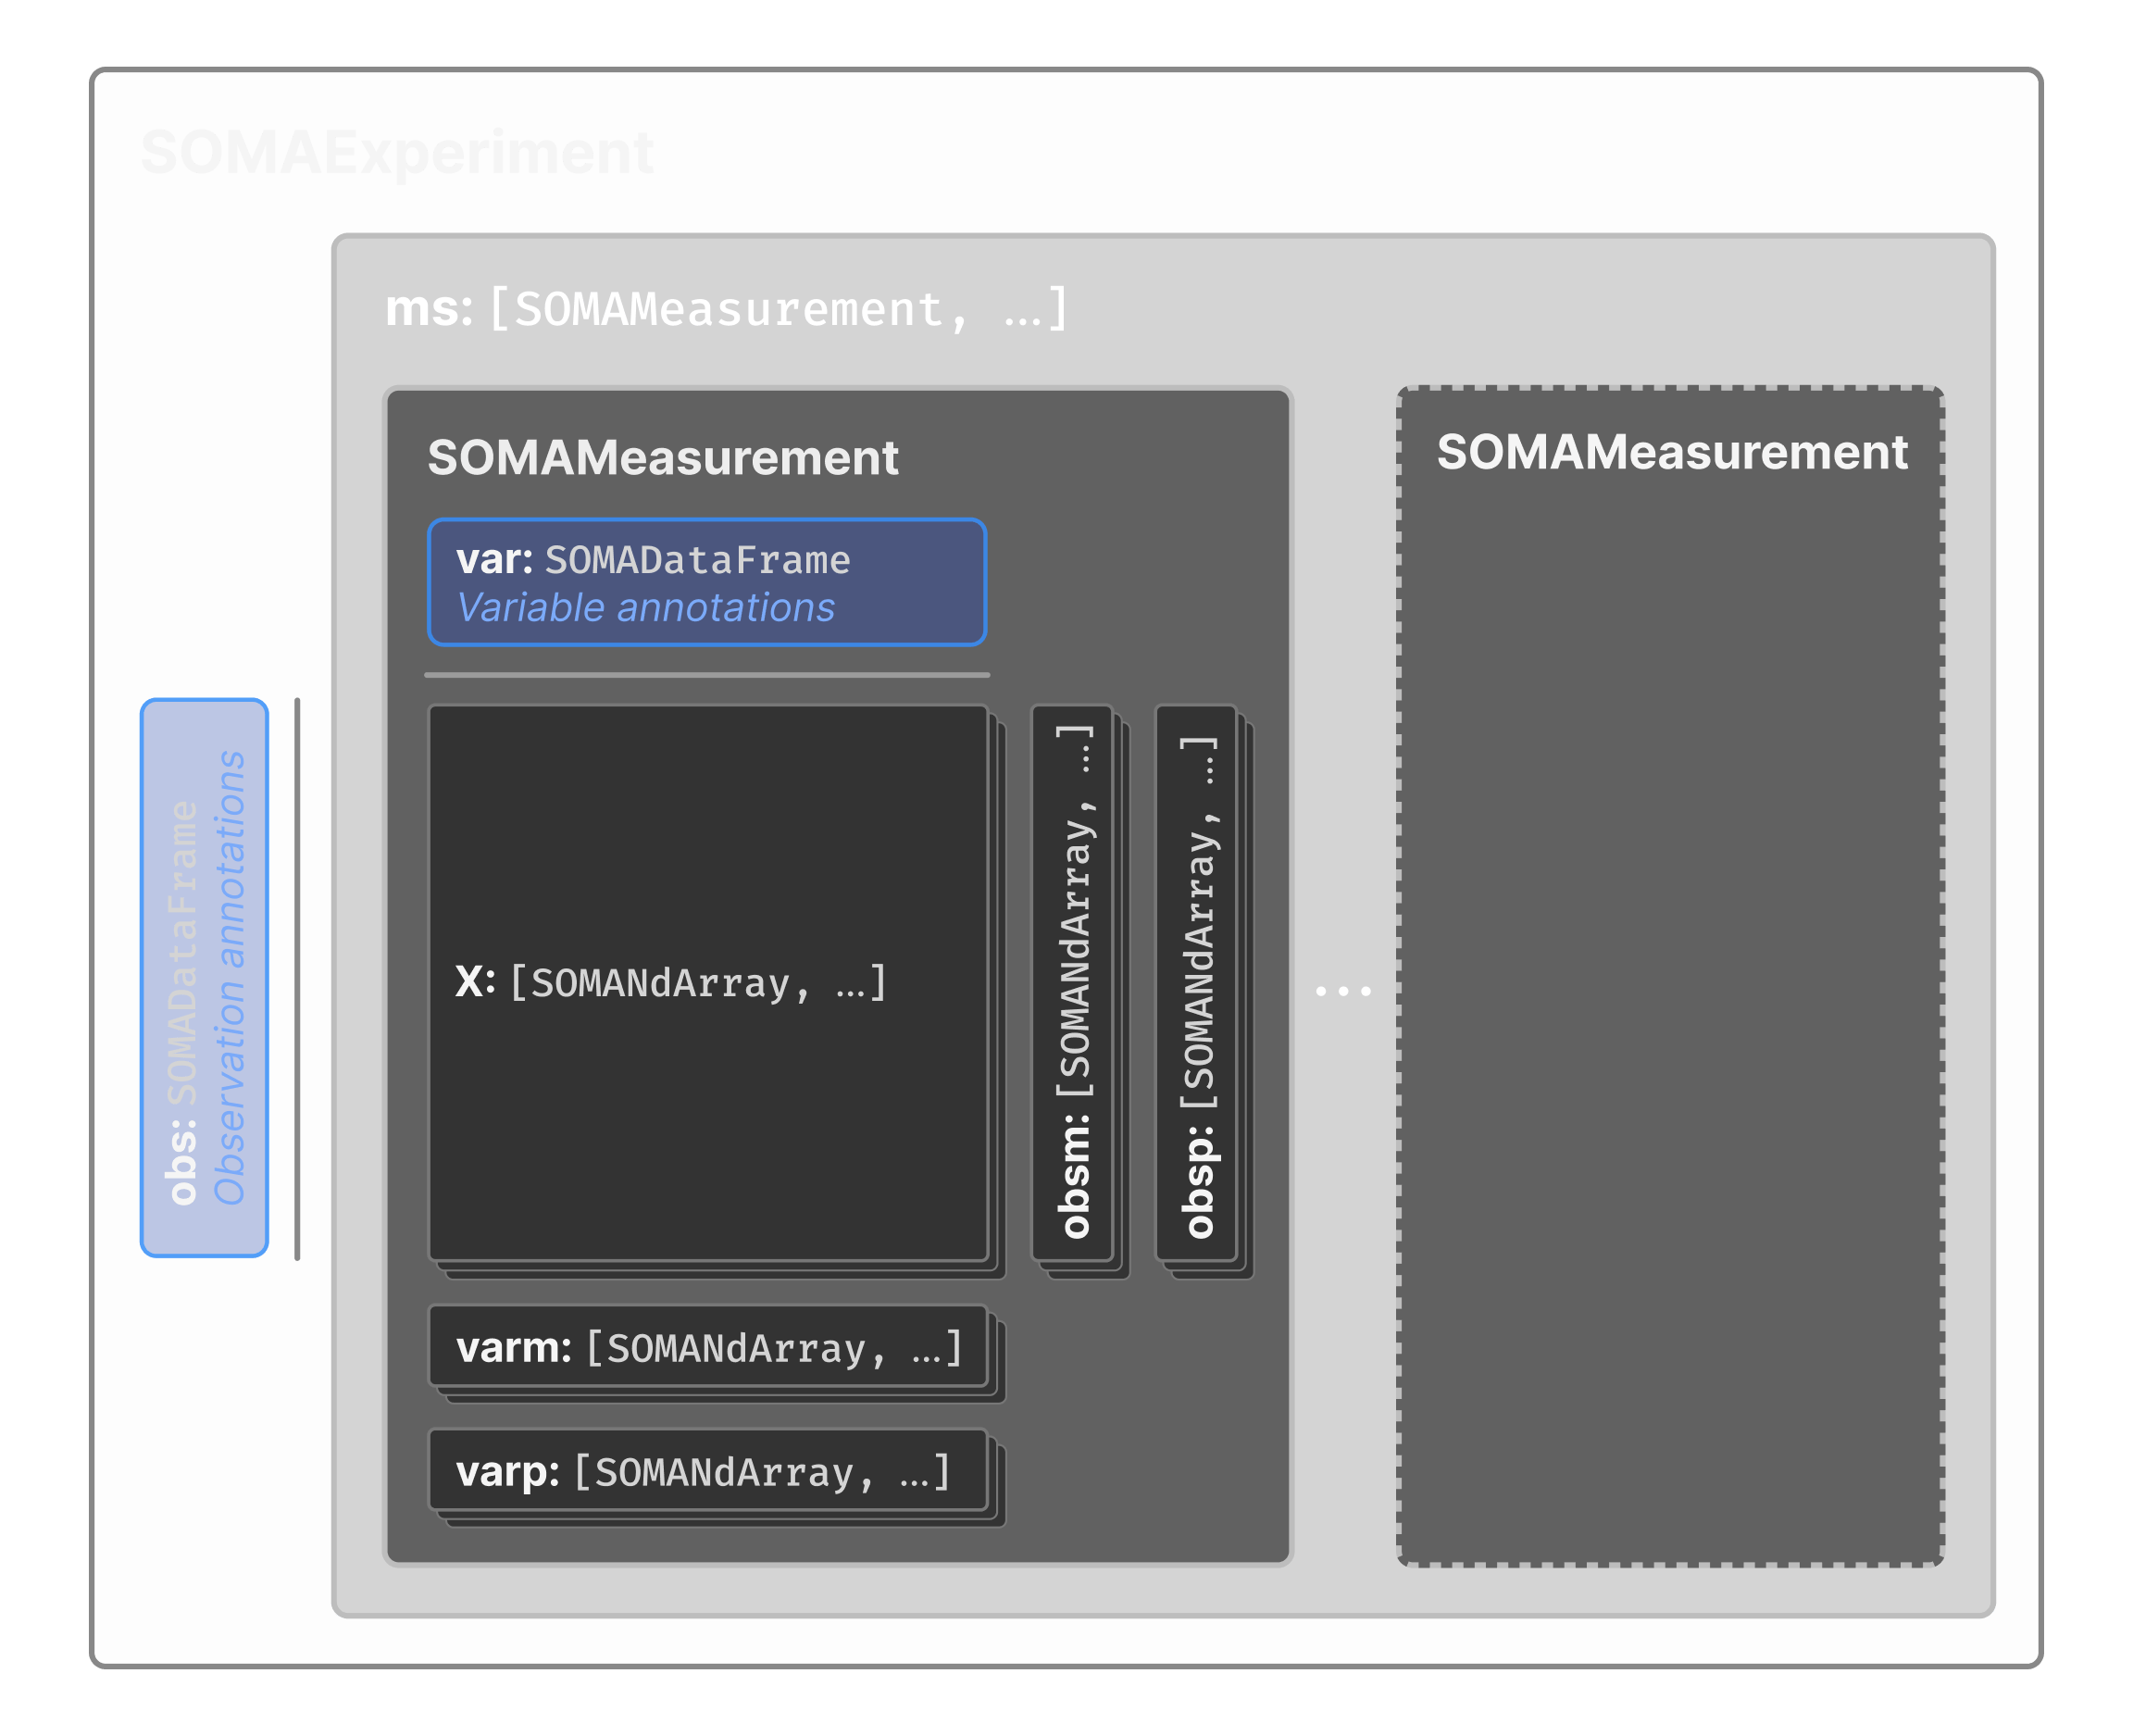
In TileDB-SOMA, each component of a single-cell dataset is stored in a dedicated TileDB array. These arrays are then organized within nested TileDB groups to form a structured hierarchy similar to the in-memory structures described previously and shown in the figure below.
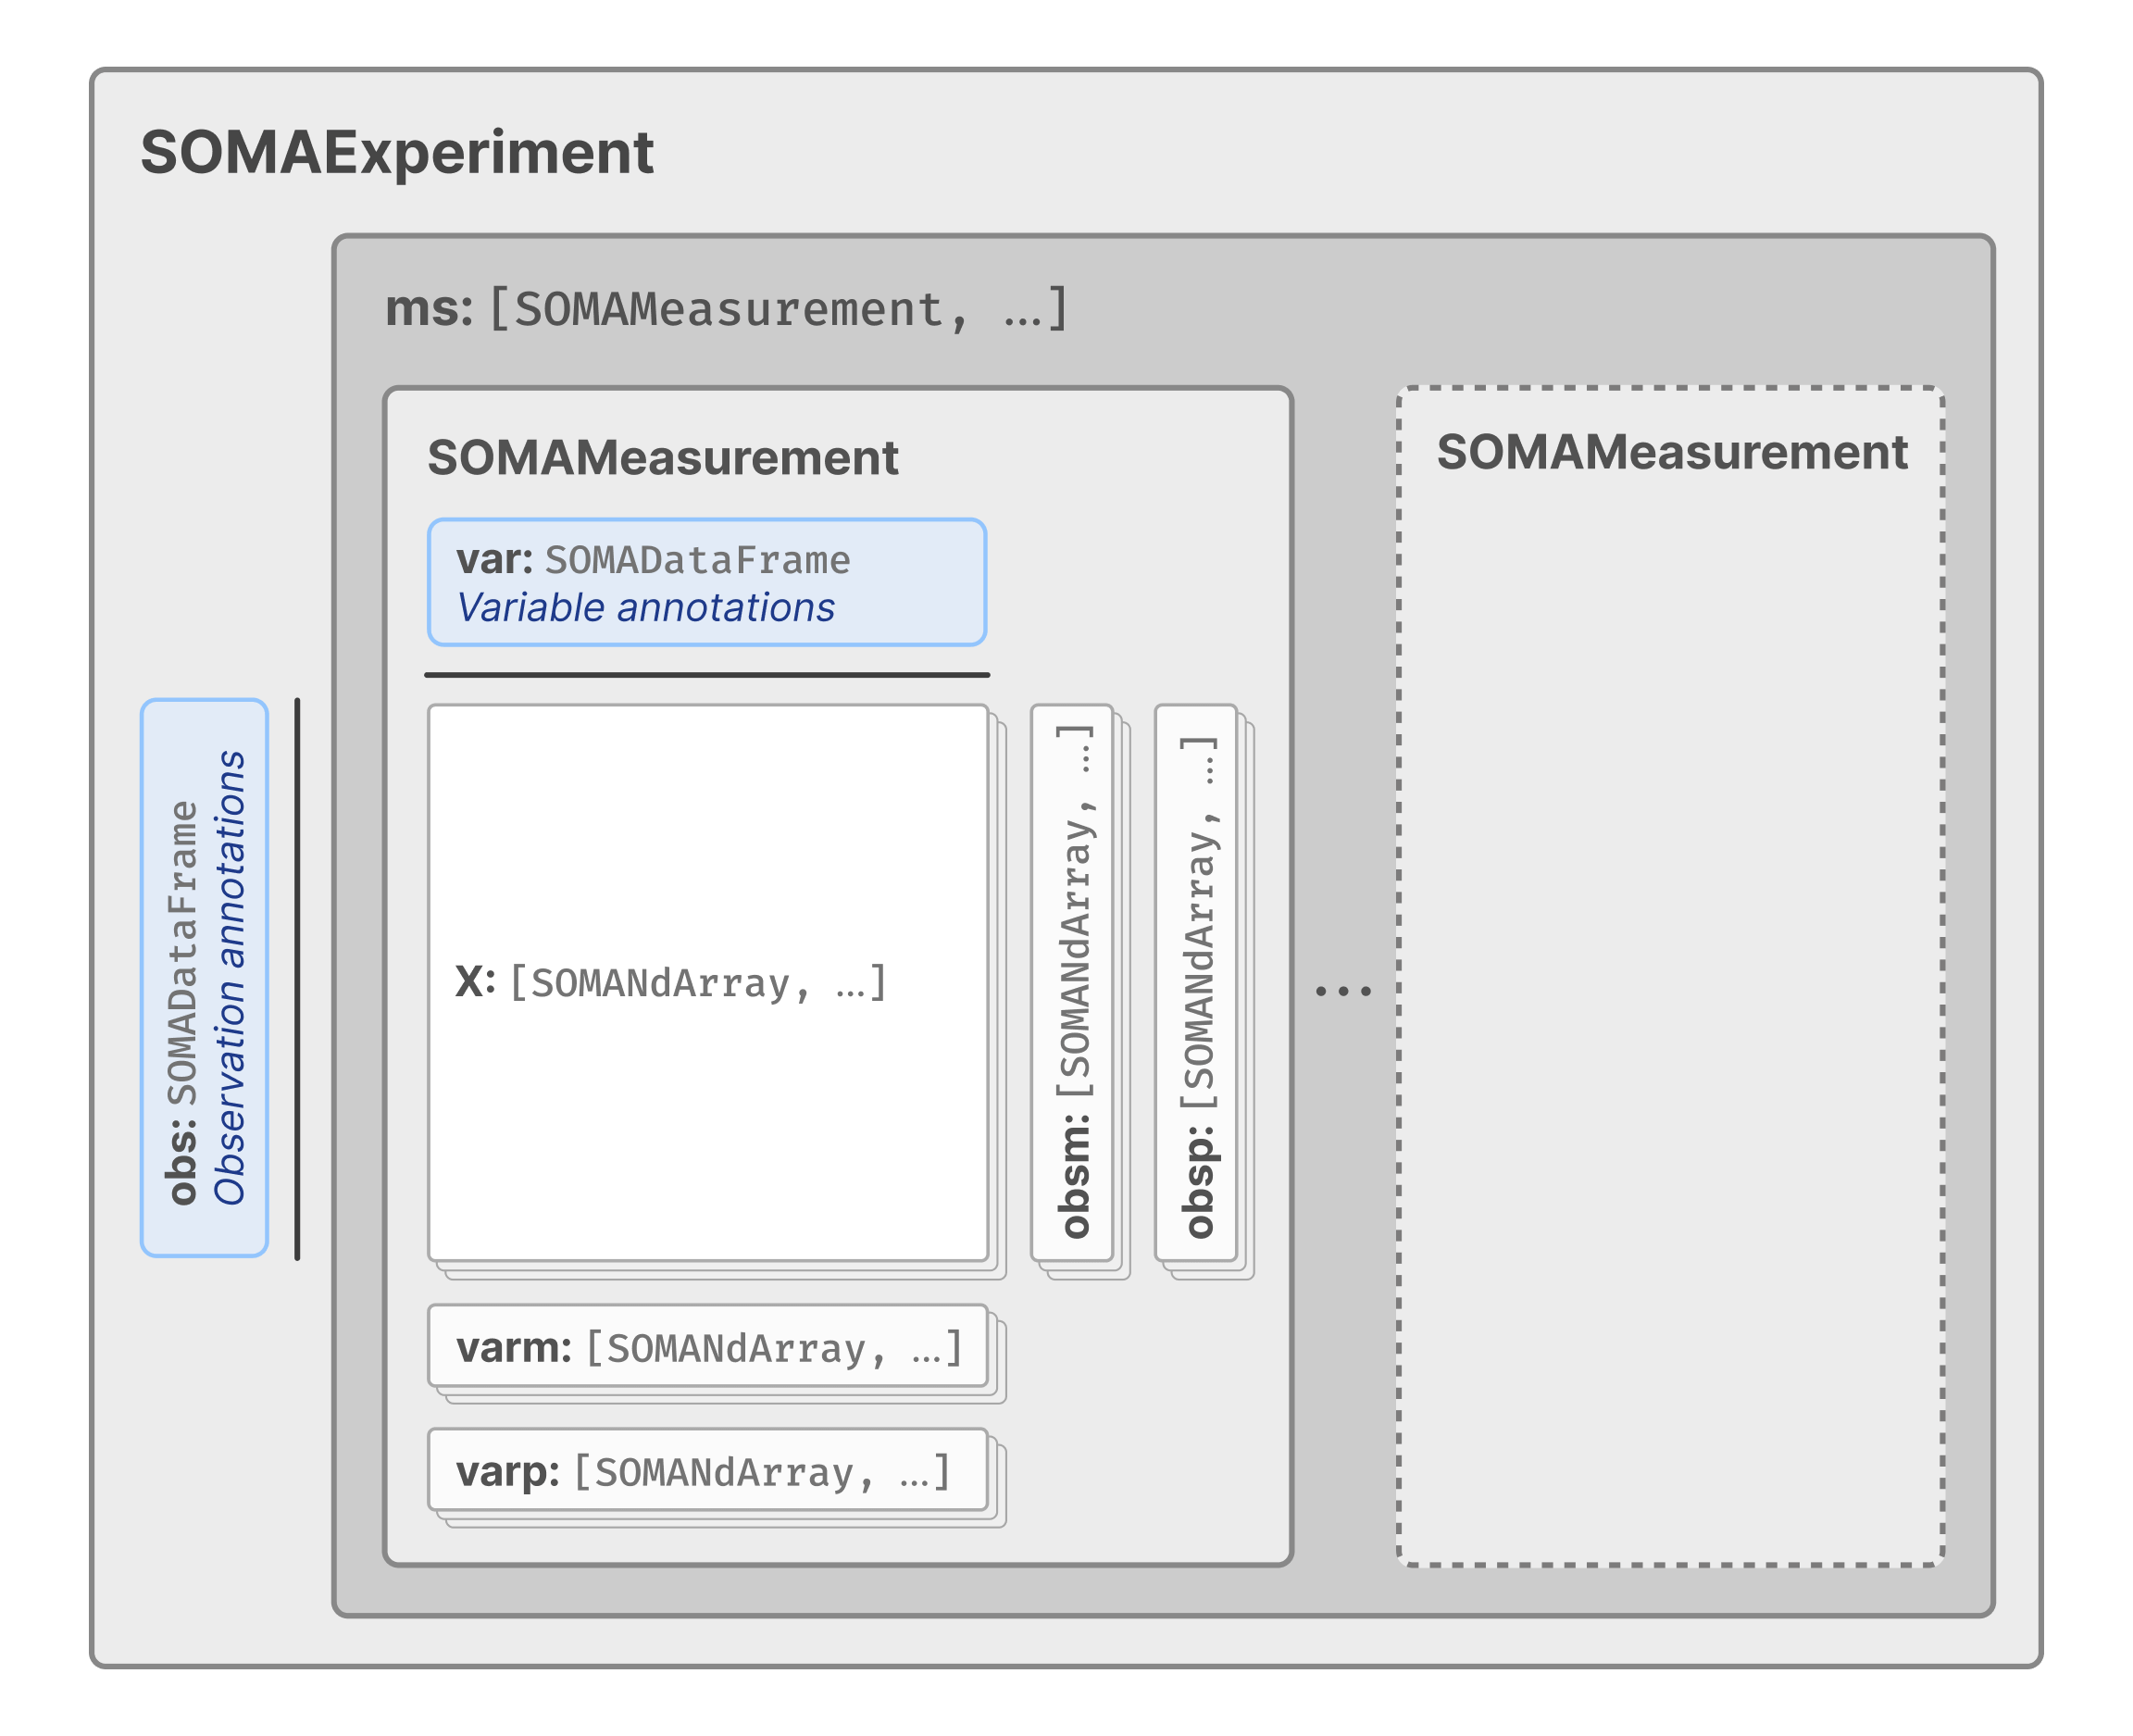
TileDB-SOMA adopts AnnData’s naming conventions for many of its components.
A SOMAExperiment is the top-level, multi-modal container for a TileDB-SOMA dataset. It contains:
obs, aSOMADataFramethat stores observation (e.g., cell) annotations.ms, aSOMACollectionthat stores one or moreSOMAMeasurementobjects.
In SOMA, a SOMAMeasurement is the container for a single modality (e.g., gene or protein expression) for the set of observations in the experiment. It contains:
var, aSOMADataFramethat stores annotations for the variables (e.g., genes or proteins) in the measured modality.X, a collection of one or moreSOMASparseNDArrays that store the measurement values collected for the modality (e.g., gene expression values). EachSOMASparseNDArraywithinXis referred to as a “layer” and allows for the storage of multiple transformations of the data (e.g., raw counts, normalized expression values).obsm/varm, which are collections ofSOMASparseNDArrays for matrix-like data where rows corresponds to observations (forobsmarrays) or variables (forvarmarrays), with variable numbers of columns. These arrays are typically used to store data like PCA coordinates, UMAP coordinates, or other derived data.obsp/varp, which are collections ofSOMASparseNDArrays for pairwise matrix-like data where rows and columns correspond to observations (forobsparrays) or variables (forvarparrays). These arrays are typically used to store data like graph-based connectivities or distances.unsis aSOMACollectionthat stores unstructured data (e.g., metadata) that does not fit into the other categories.
The TileDB-SOMA dataset is organized on disk as follows, considering that the example has a dataset called pbmc3k.
pbmc3k/
├── ms/
│   │
│   └── RNA/
│       ├── var
│       ├── X/
│       │   ├── raw
│       │   └── normalized
│       ├── obsm/
│       │   ├── pca
│       │   └── umap
│       ├── obsp/
│       │   ├── connectivities
│       │   └── distances
│       ├── varm/
│       │   └── PCs
│       └── uns/
└── obs
In the above tree structure, leaf nodes ending with / represent SOMACollections (or SOMACollection subclasses such as SOMAExperiment or SOMAMeasurement). Other nodes are arrays (e.g., SOMADataFrame, SOMASparseNDArray, etc).
You can see this dataset contains a single modality: RNA. The X collection contains two layers: raw and normalized, which store the raw and normalized expression values, respectively. Results from PCA and UMAP analyses are stored in the obsm (and varm) collection, while pairwise connectivities and distances are stored in the obsp collection.
For more technical details about SOMA’s data structures and data model, visit the SOMA specification.