Task Graph Log
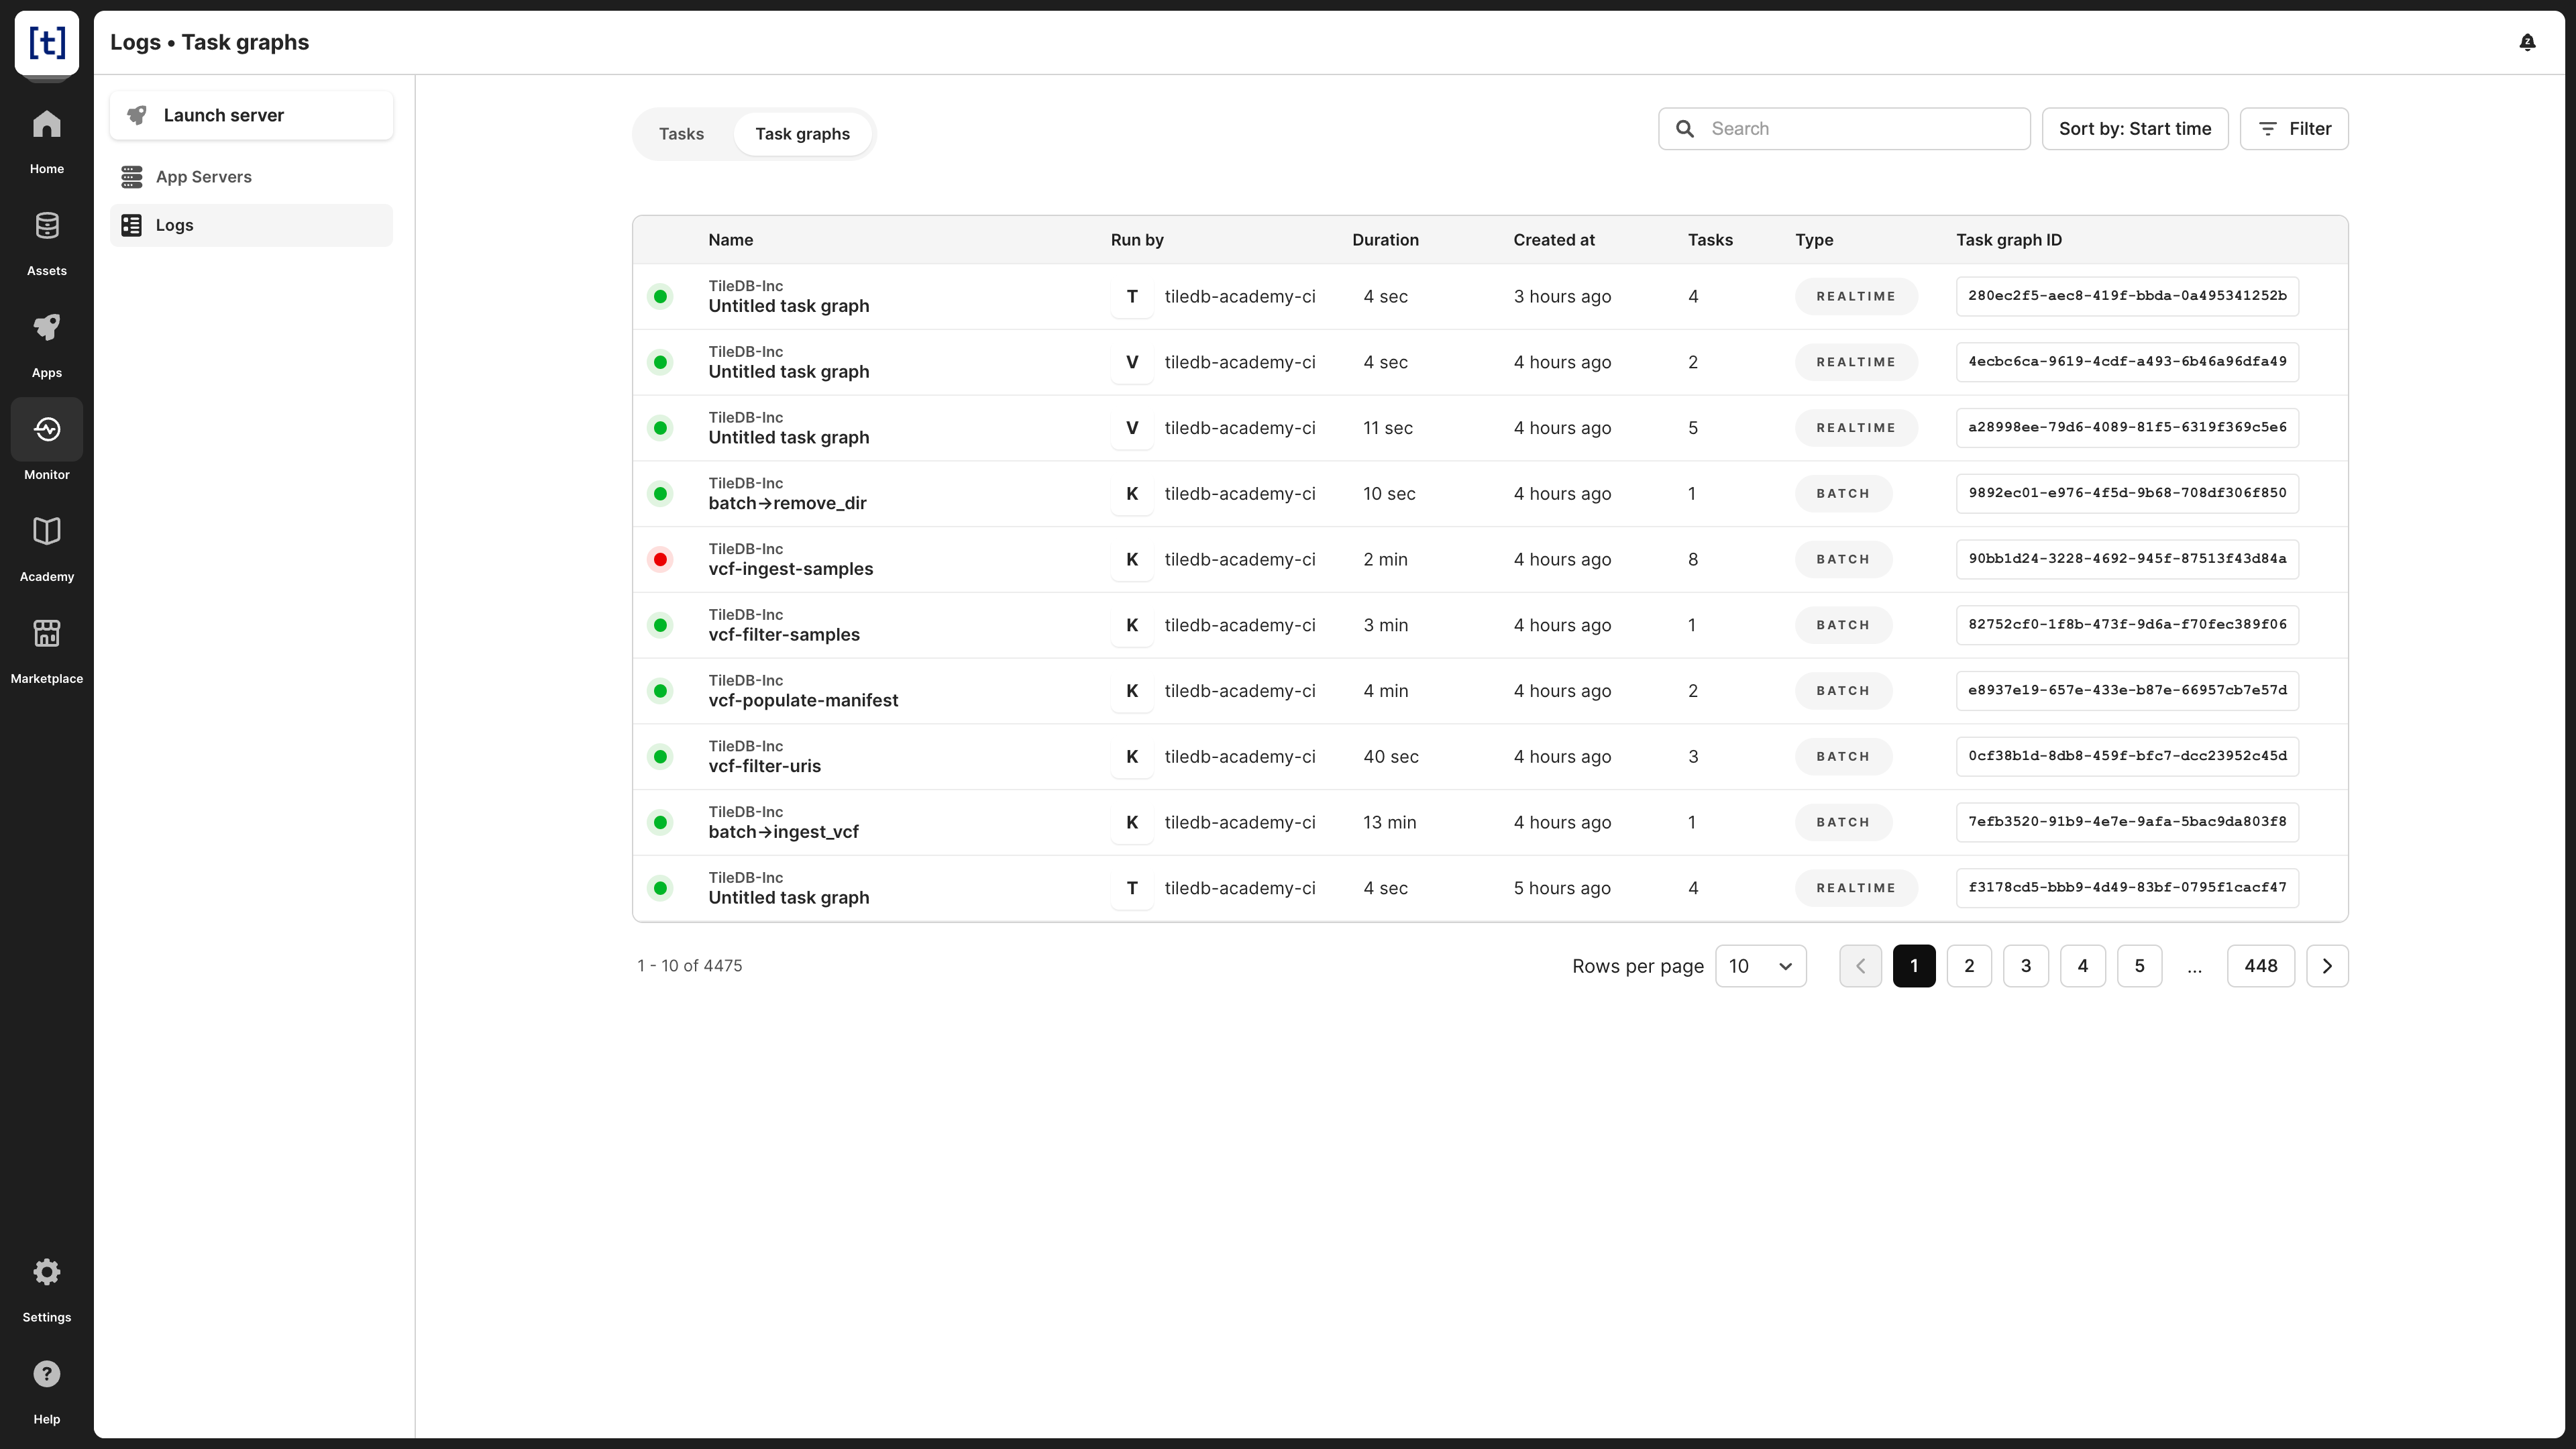
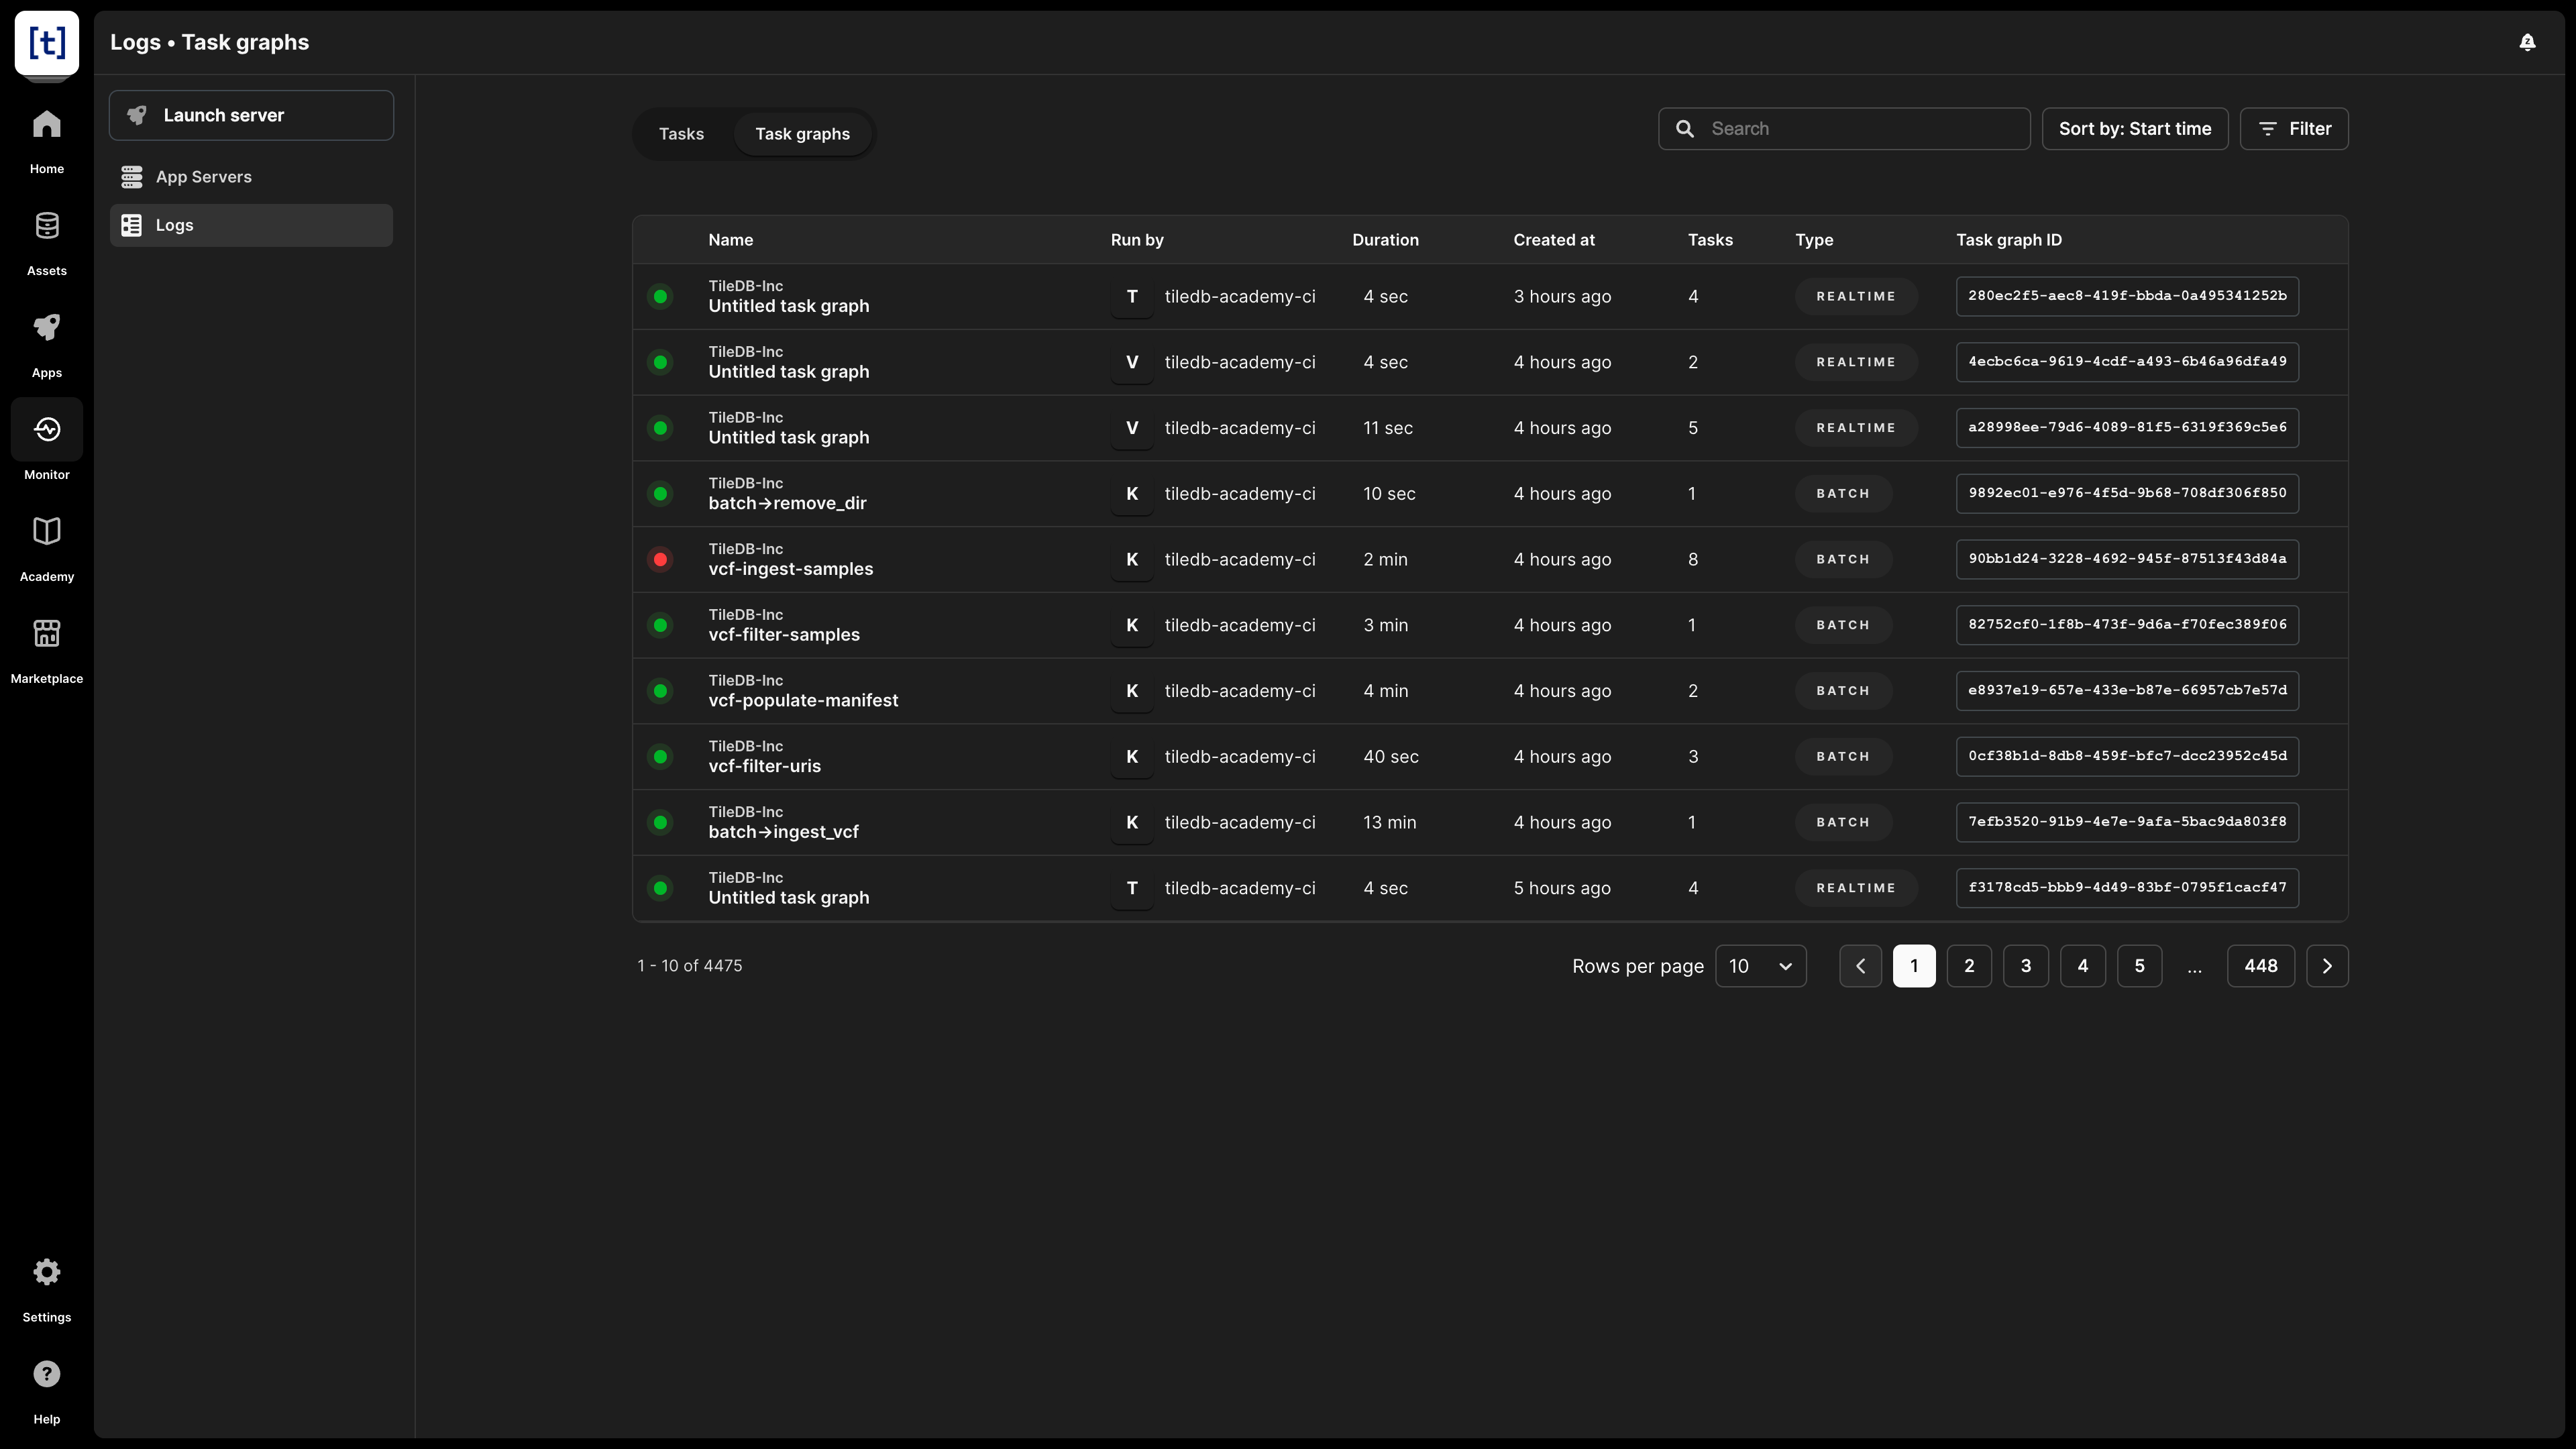
In TileDB Cloud, you can review log entries of the task graphs of your namespace under the Compute > Logs screen, if you switch to the Task graphs tab.
Task Graph Log table view
The table view has the following information:
- The dot implies the status of the task graph. Possible colors are green (
UNFINISHED), blue (SUCCEEDED), red (FAILED), and yellow (CANCELLED). You can hover over the dot to see the status value. - Name - The title of the Task Graph.
- Namespace - The namespace from where this task graph was launched.
- Ran by - Who launched the task.
- Duration - The duration of the task graph since it launched.
- Start time - When this task graph was initiated.
- Tasks - The number of nodes that this task graph includes.
- Type - The type of the task graph,
REALTIMEorBATCH. - TASK GRAPH ID - The unique ID you can track the execution of the task graph uniquely.
This list has a complete view of the log entries of your namespaces’ task graphs. To focus on what matters, you may:
- Search by task graph name.
- Filter by Range (last
7,30, or90days) or by Status.
To find your own task graphs, go to Monitor > Logs > Tasks and search by your username. For better filtering, you can even define the type of task graph you used (batch UDF vs. generic UDF) through the filters. By selecting the details of the task, you can locate the Parent task graph to see the task graph that ran this task.
Task Graph Log detailed view
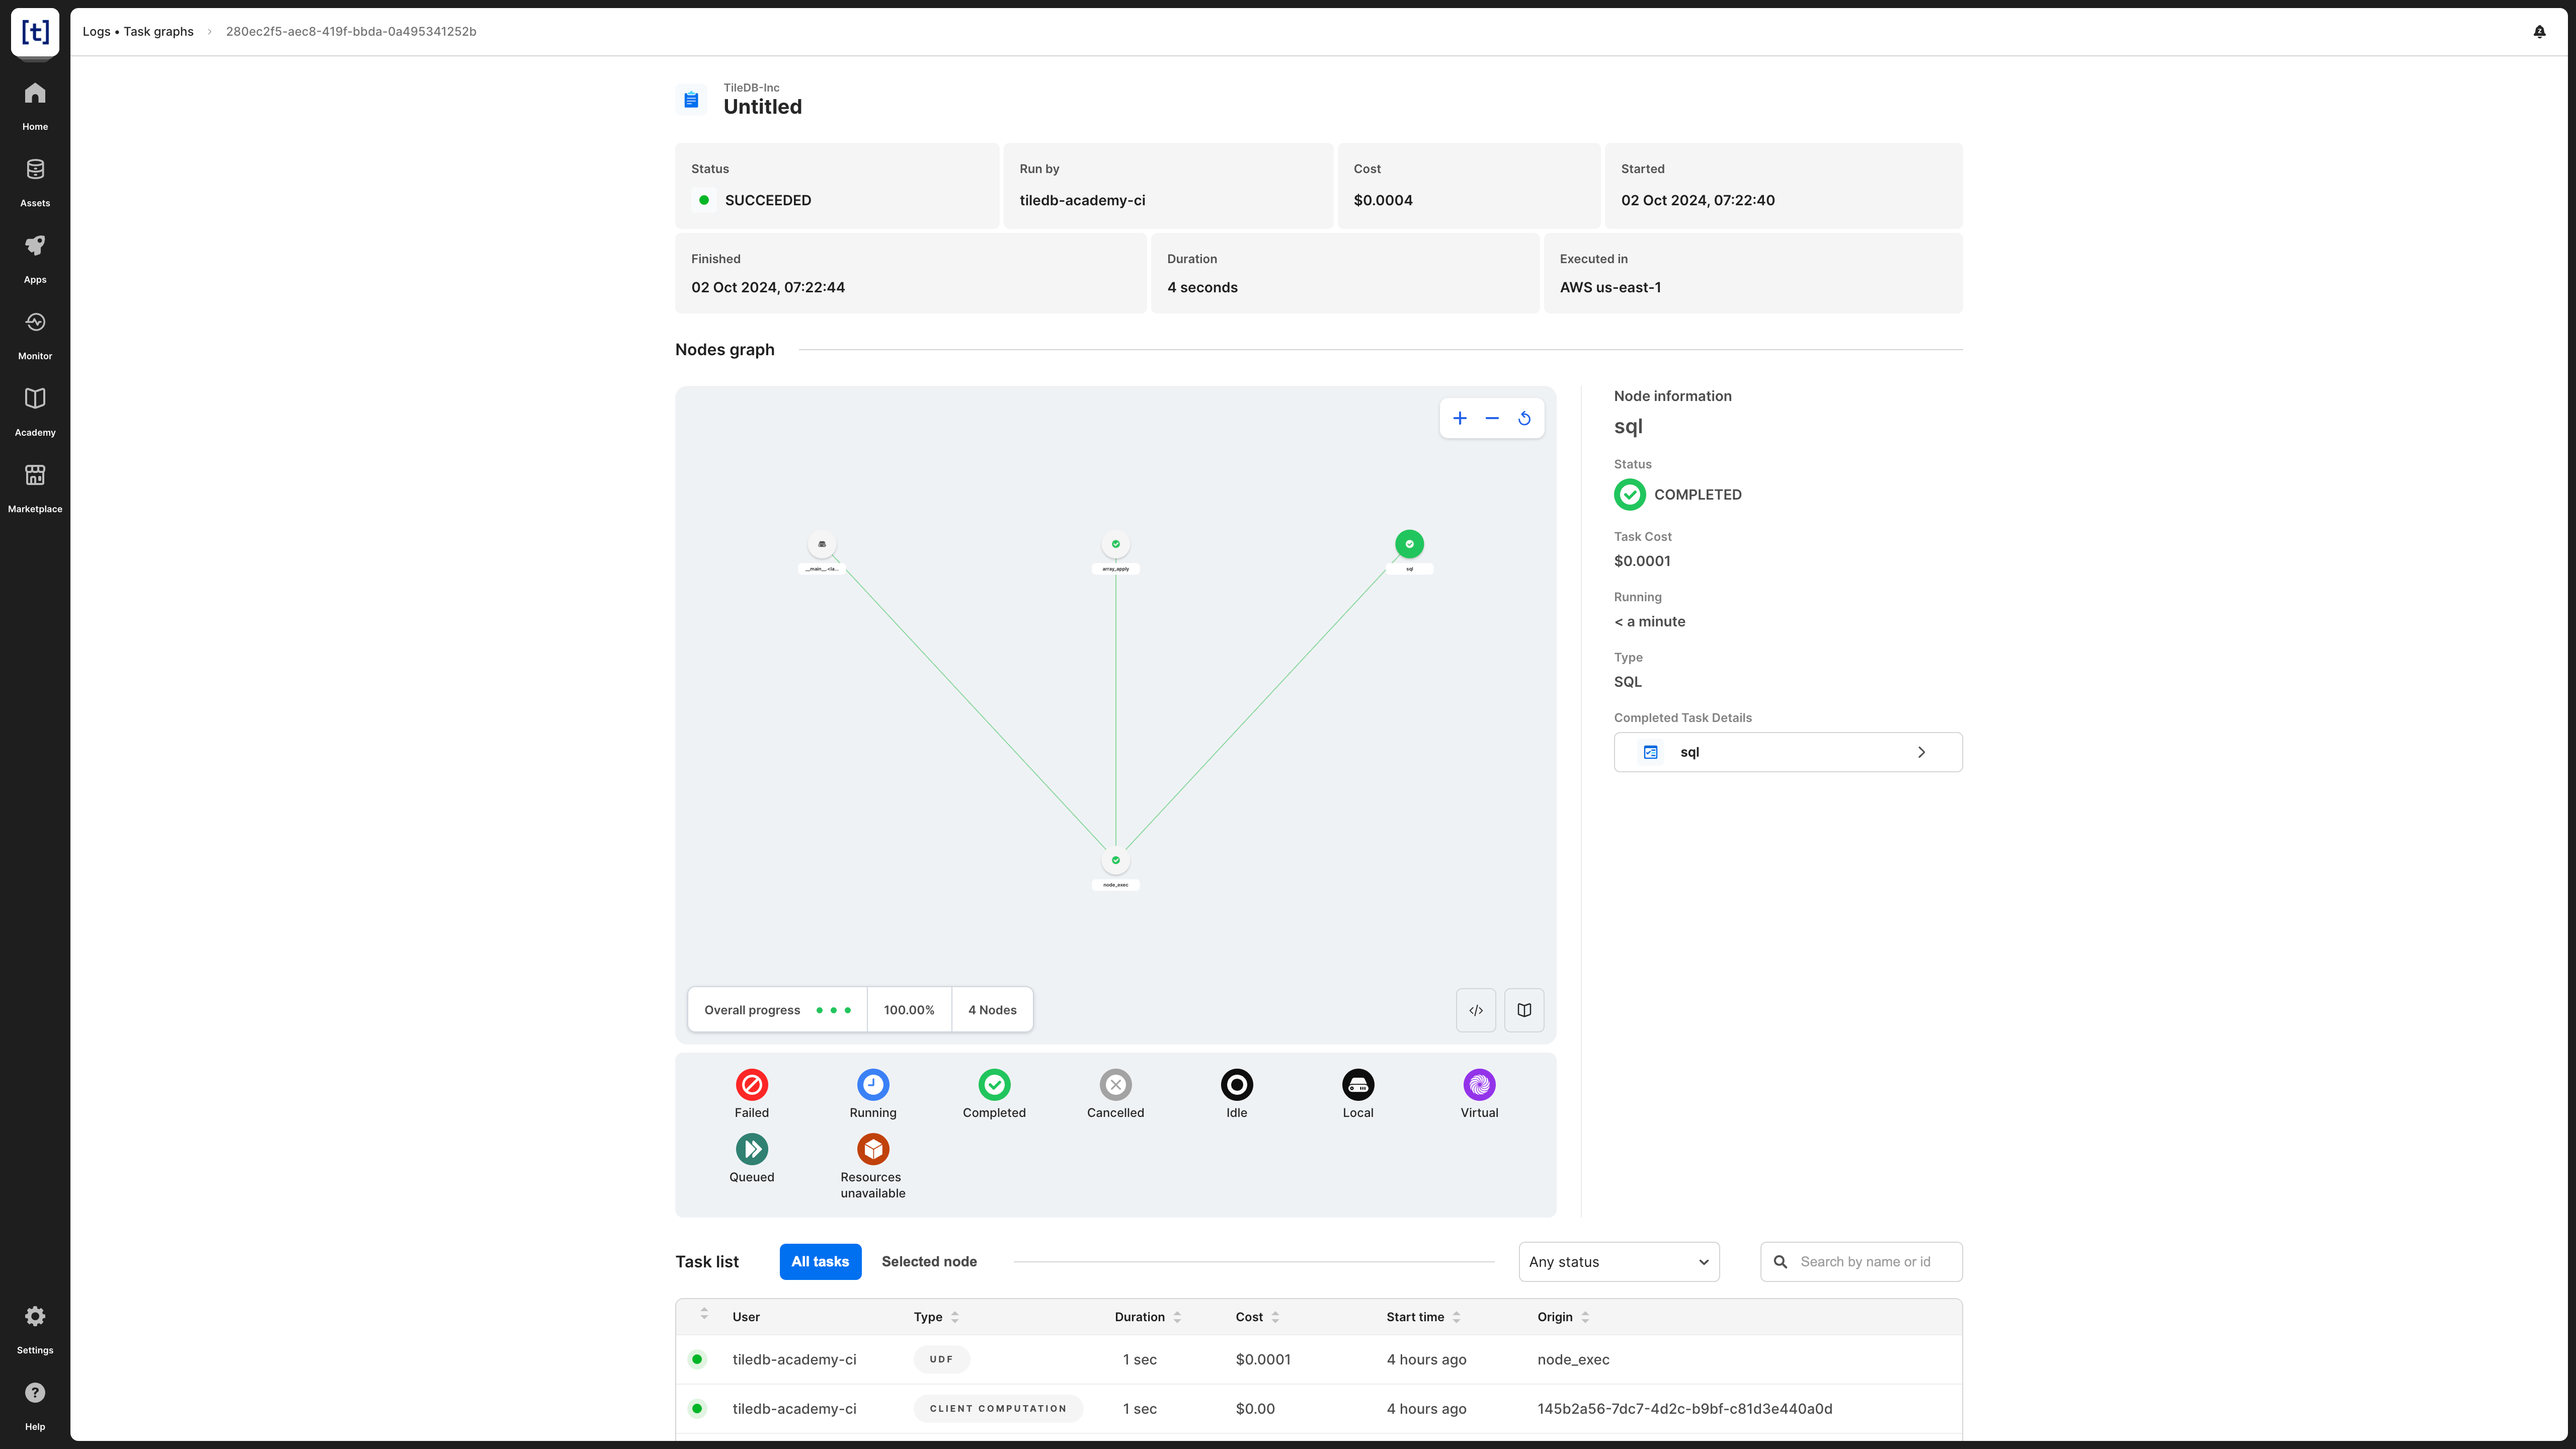
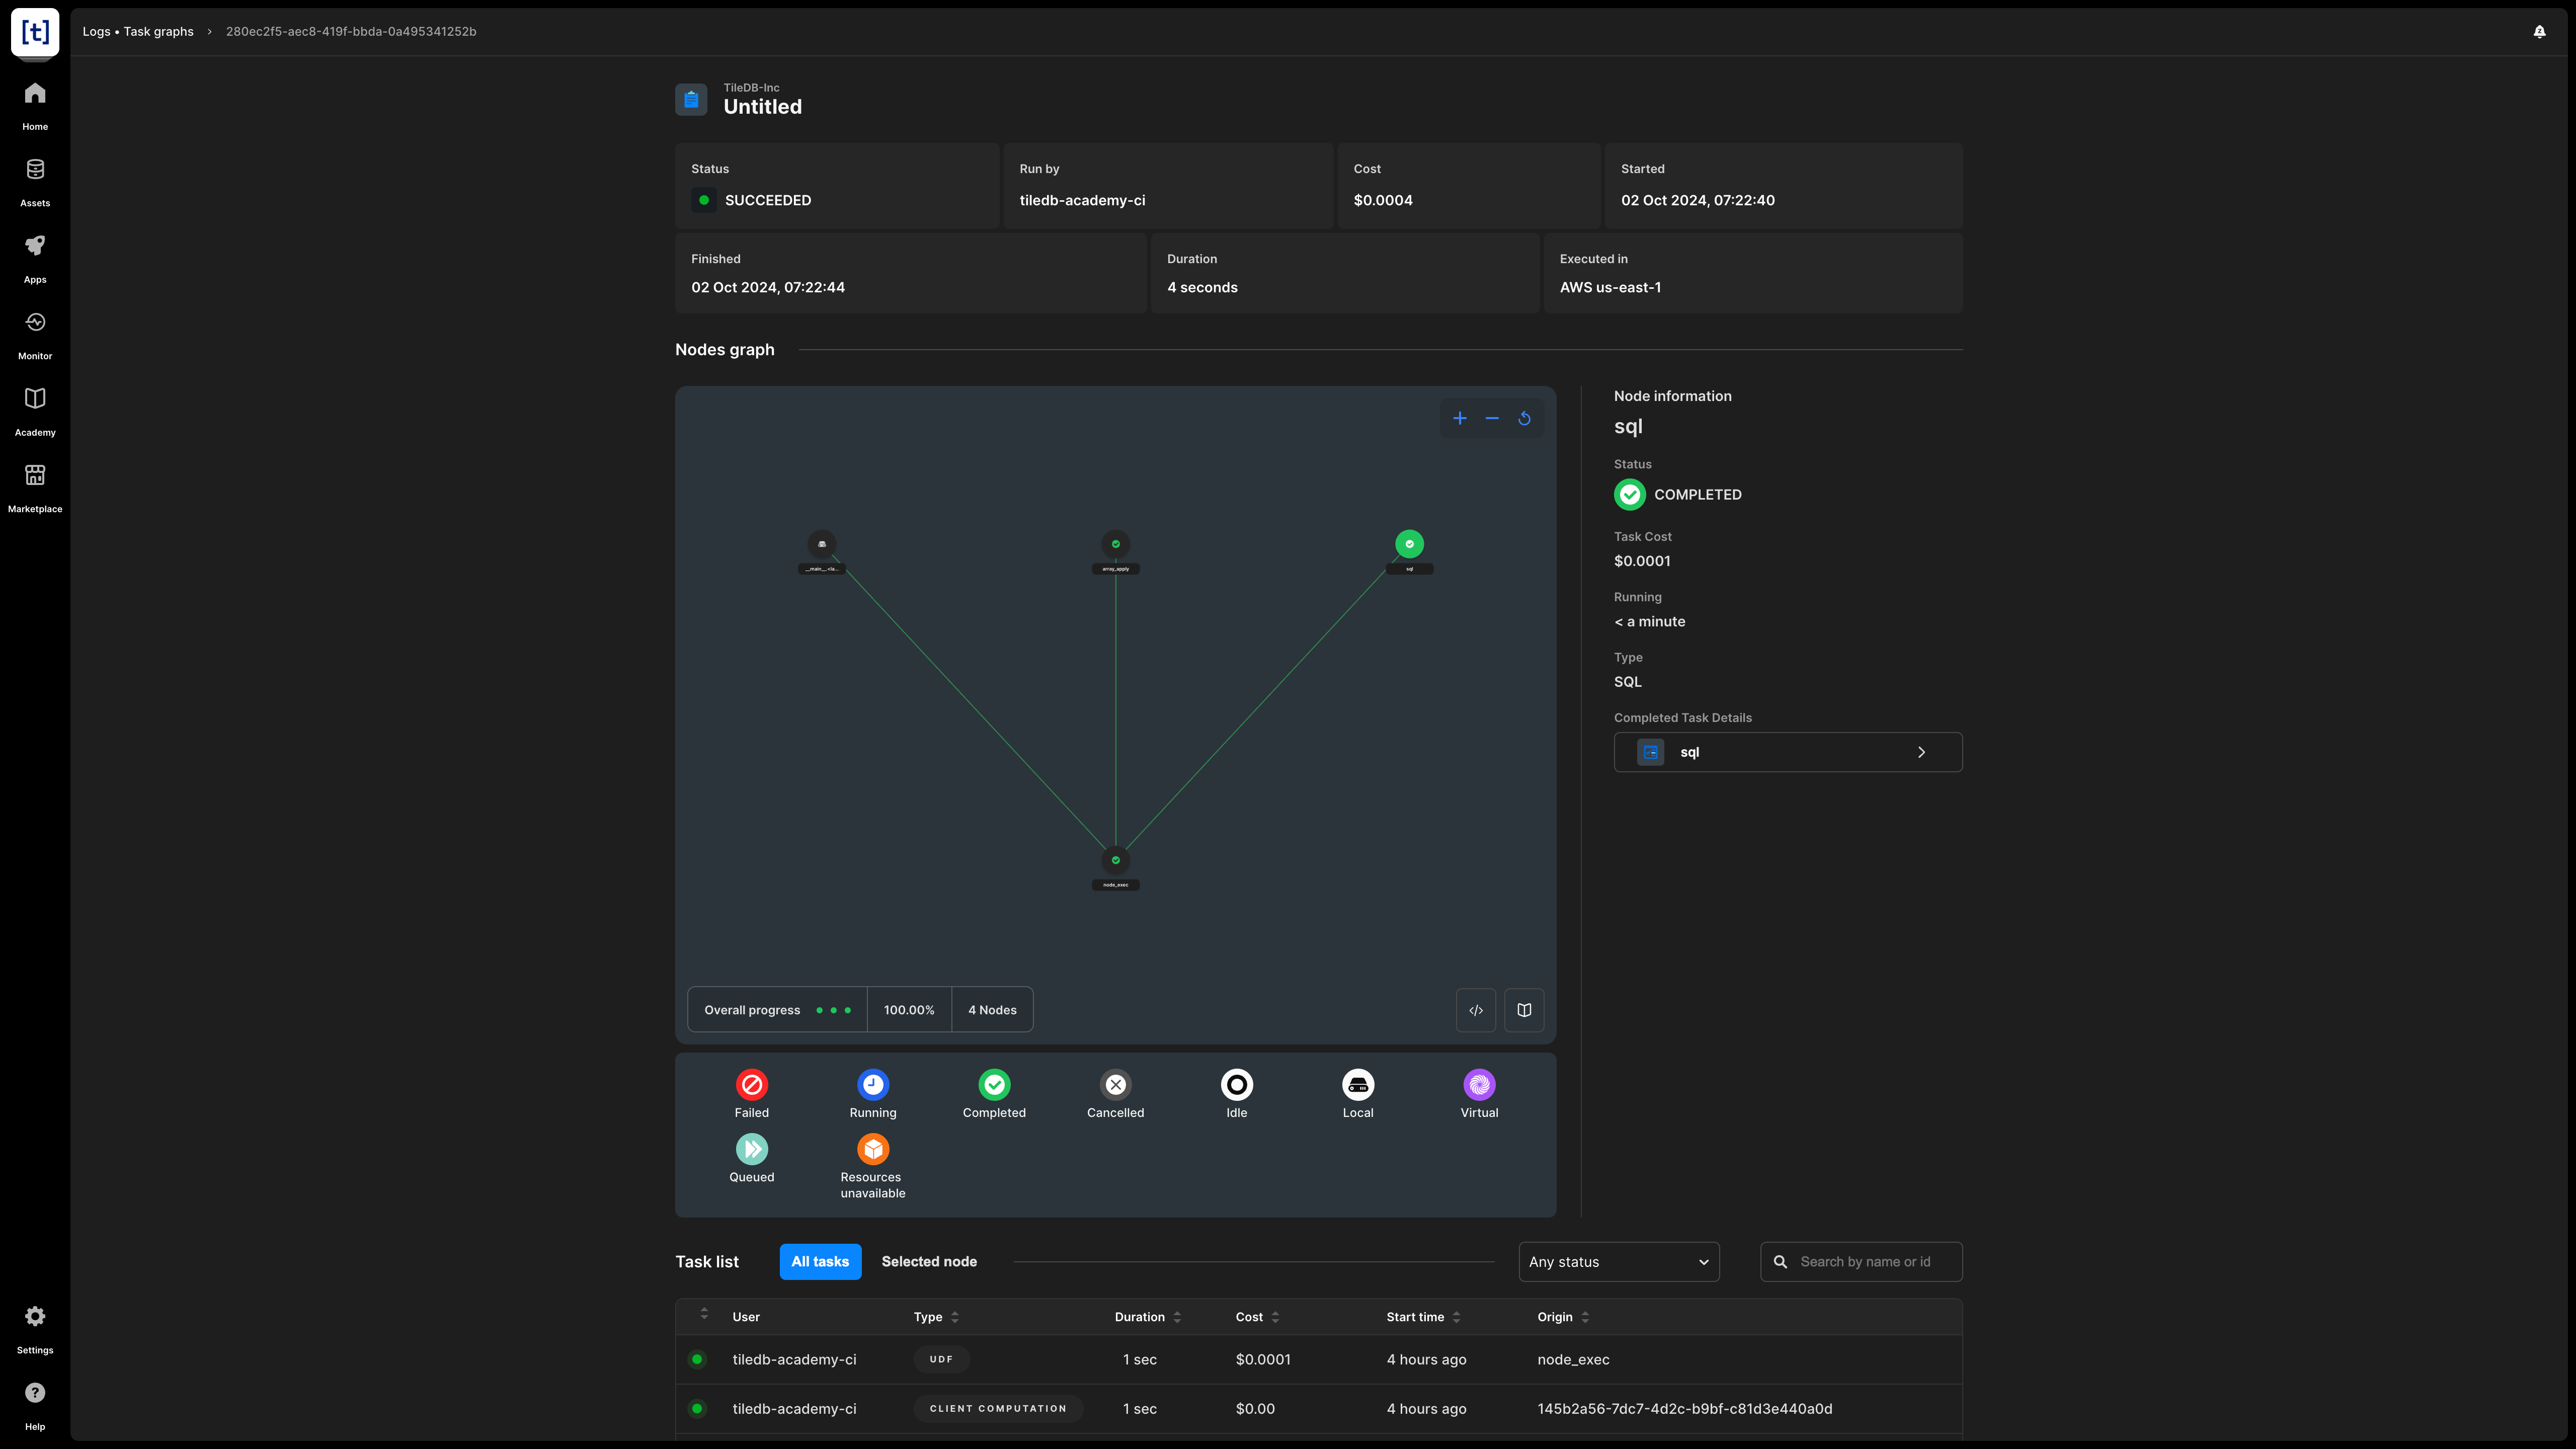
By selecting a task graph entry, you can see even more details for it. Apart from the information you can see on the list, you can see in detail:
- The Status of the task graph in plain text.
- The Cost of the task graph execution.
- The Finished timestamp of the task graph execution.
- Run by - The user who ran the task graph.
- Nodes graph - An interactive graph of the tasks within the task graph and their individual statuses, followed by a legend of all possible task states. Selecting a node will show you detailed Node information, such as:
- The Node name.
- The Status of the node.
- The Task Cost.
- The Running time of the node.
- The node’s Type.
- The Language used for the task.
- A link to the Completed Task Details, which opens the associated entry in the Task Log.
- The Task list for all tasks associated with this task graph execution. You can display All tasks or the Selected node from the interactive Nodes graph, and you can filter by node status. Selecting a row in this table will open the associated entry in the Task Log.


