Introduction to Dashboards
This section is under construction and will be expanded soon. Please stay tuned and contact us if you have any questions we can answer in the meantime.
Dashboards
TileDB supports creation of dashboards backed by Jupyter notebooks for no-code, graphical presentation of results, as well as interactive user analysis and interaction by using widgets.
Dashboards are backed by notebooks (either Python with Panel, or R with Shiny) and presented by Voilà. Within TileDB Cloud’s catalog settings, you can mark a notebook as a dashboard, at which point TileDB creates a new dashboard-presentable form of the notebook, available as a new asset.
Create a dashboard
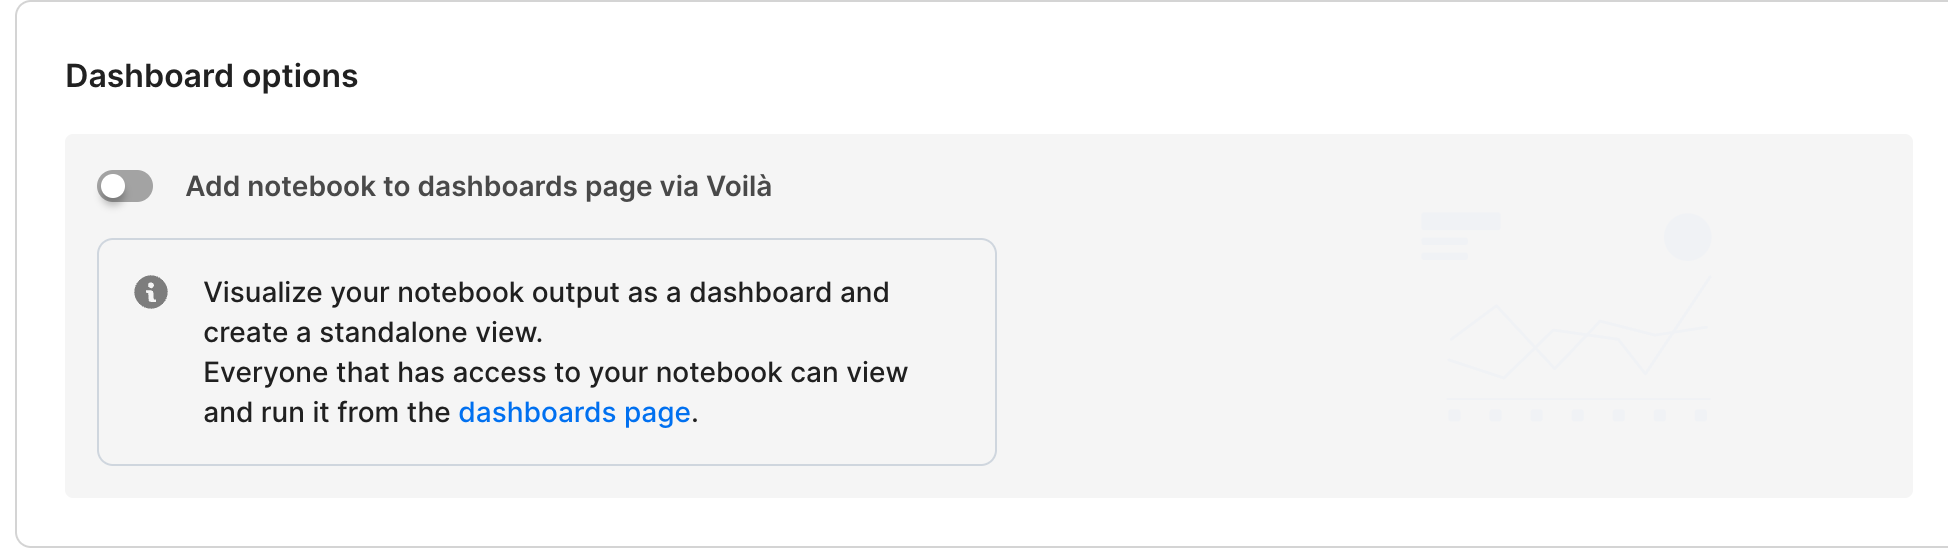
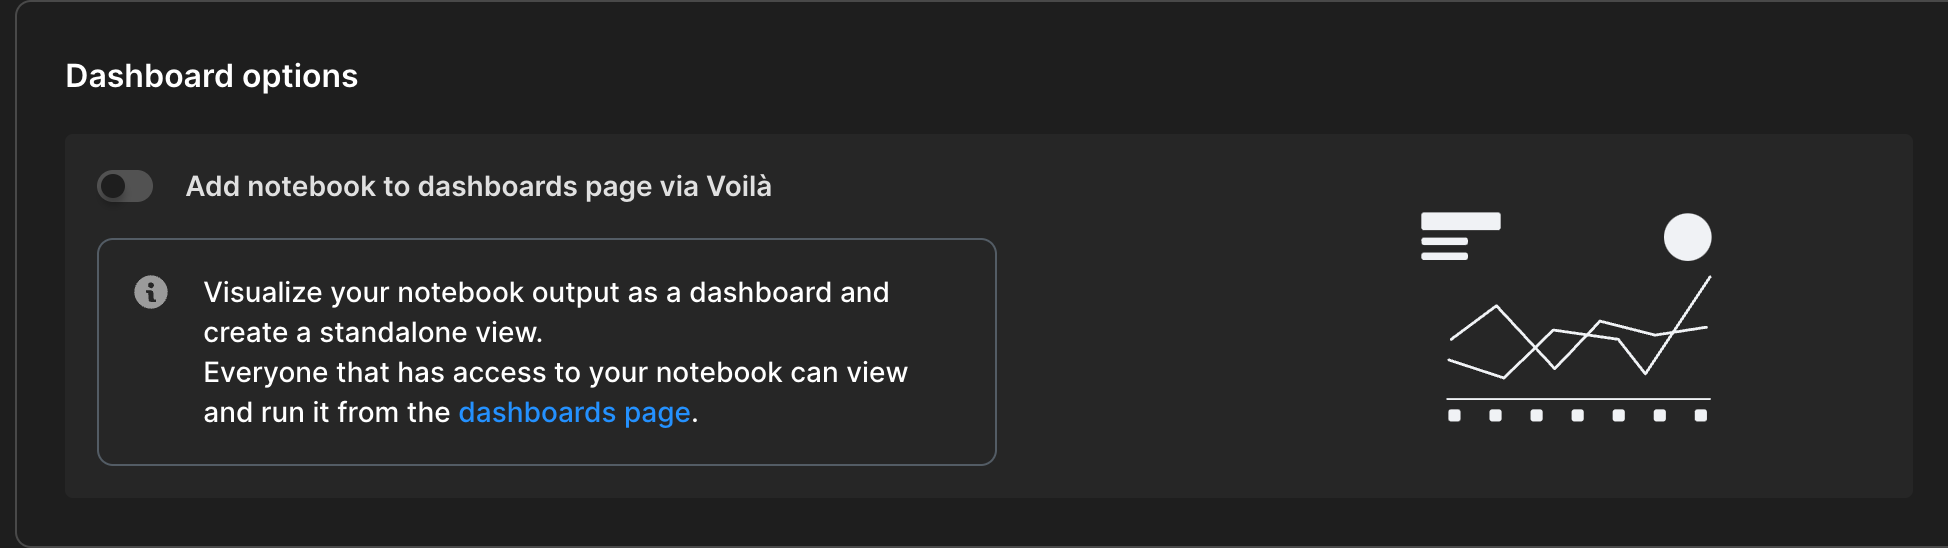
To create a dashboard, start from a new notebook. Add all necessary content (including widgets) to the notebook, and close the notebook environment. Next, visit the notebook Settings page, and select Add Notebook to dashboards page via Voilà to turn the notebook asset into a dashboard:
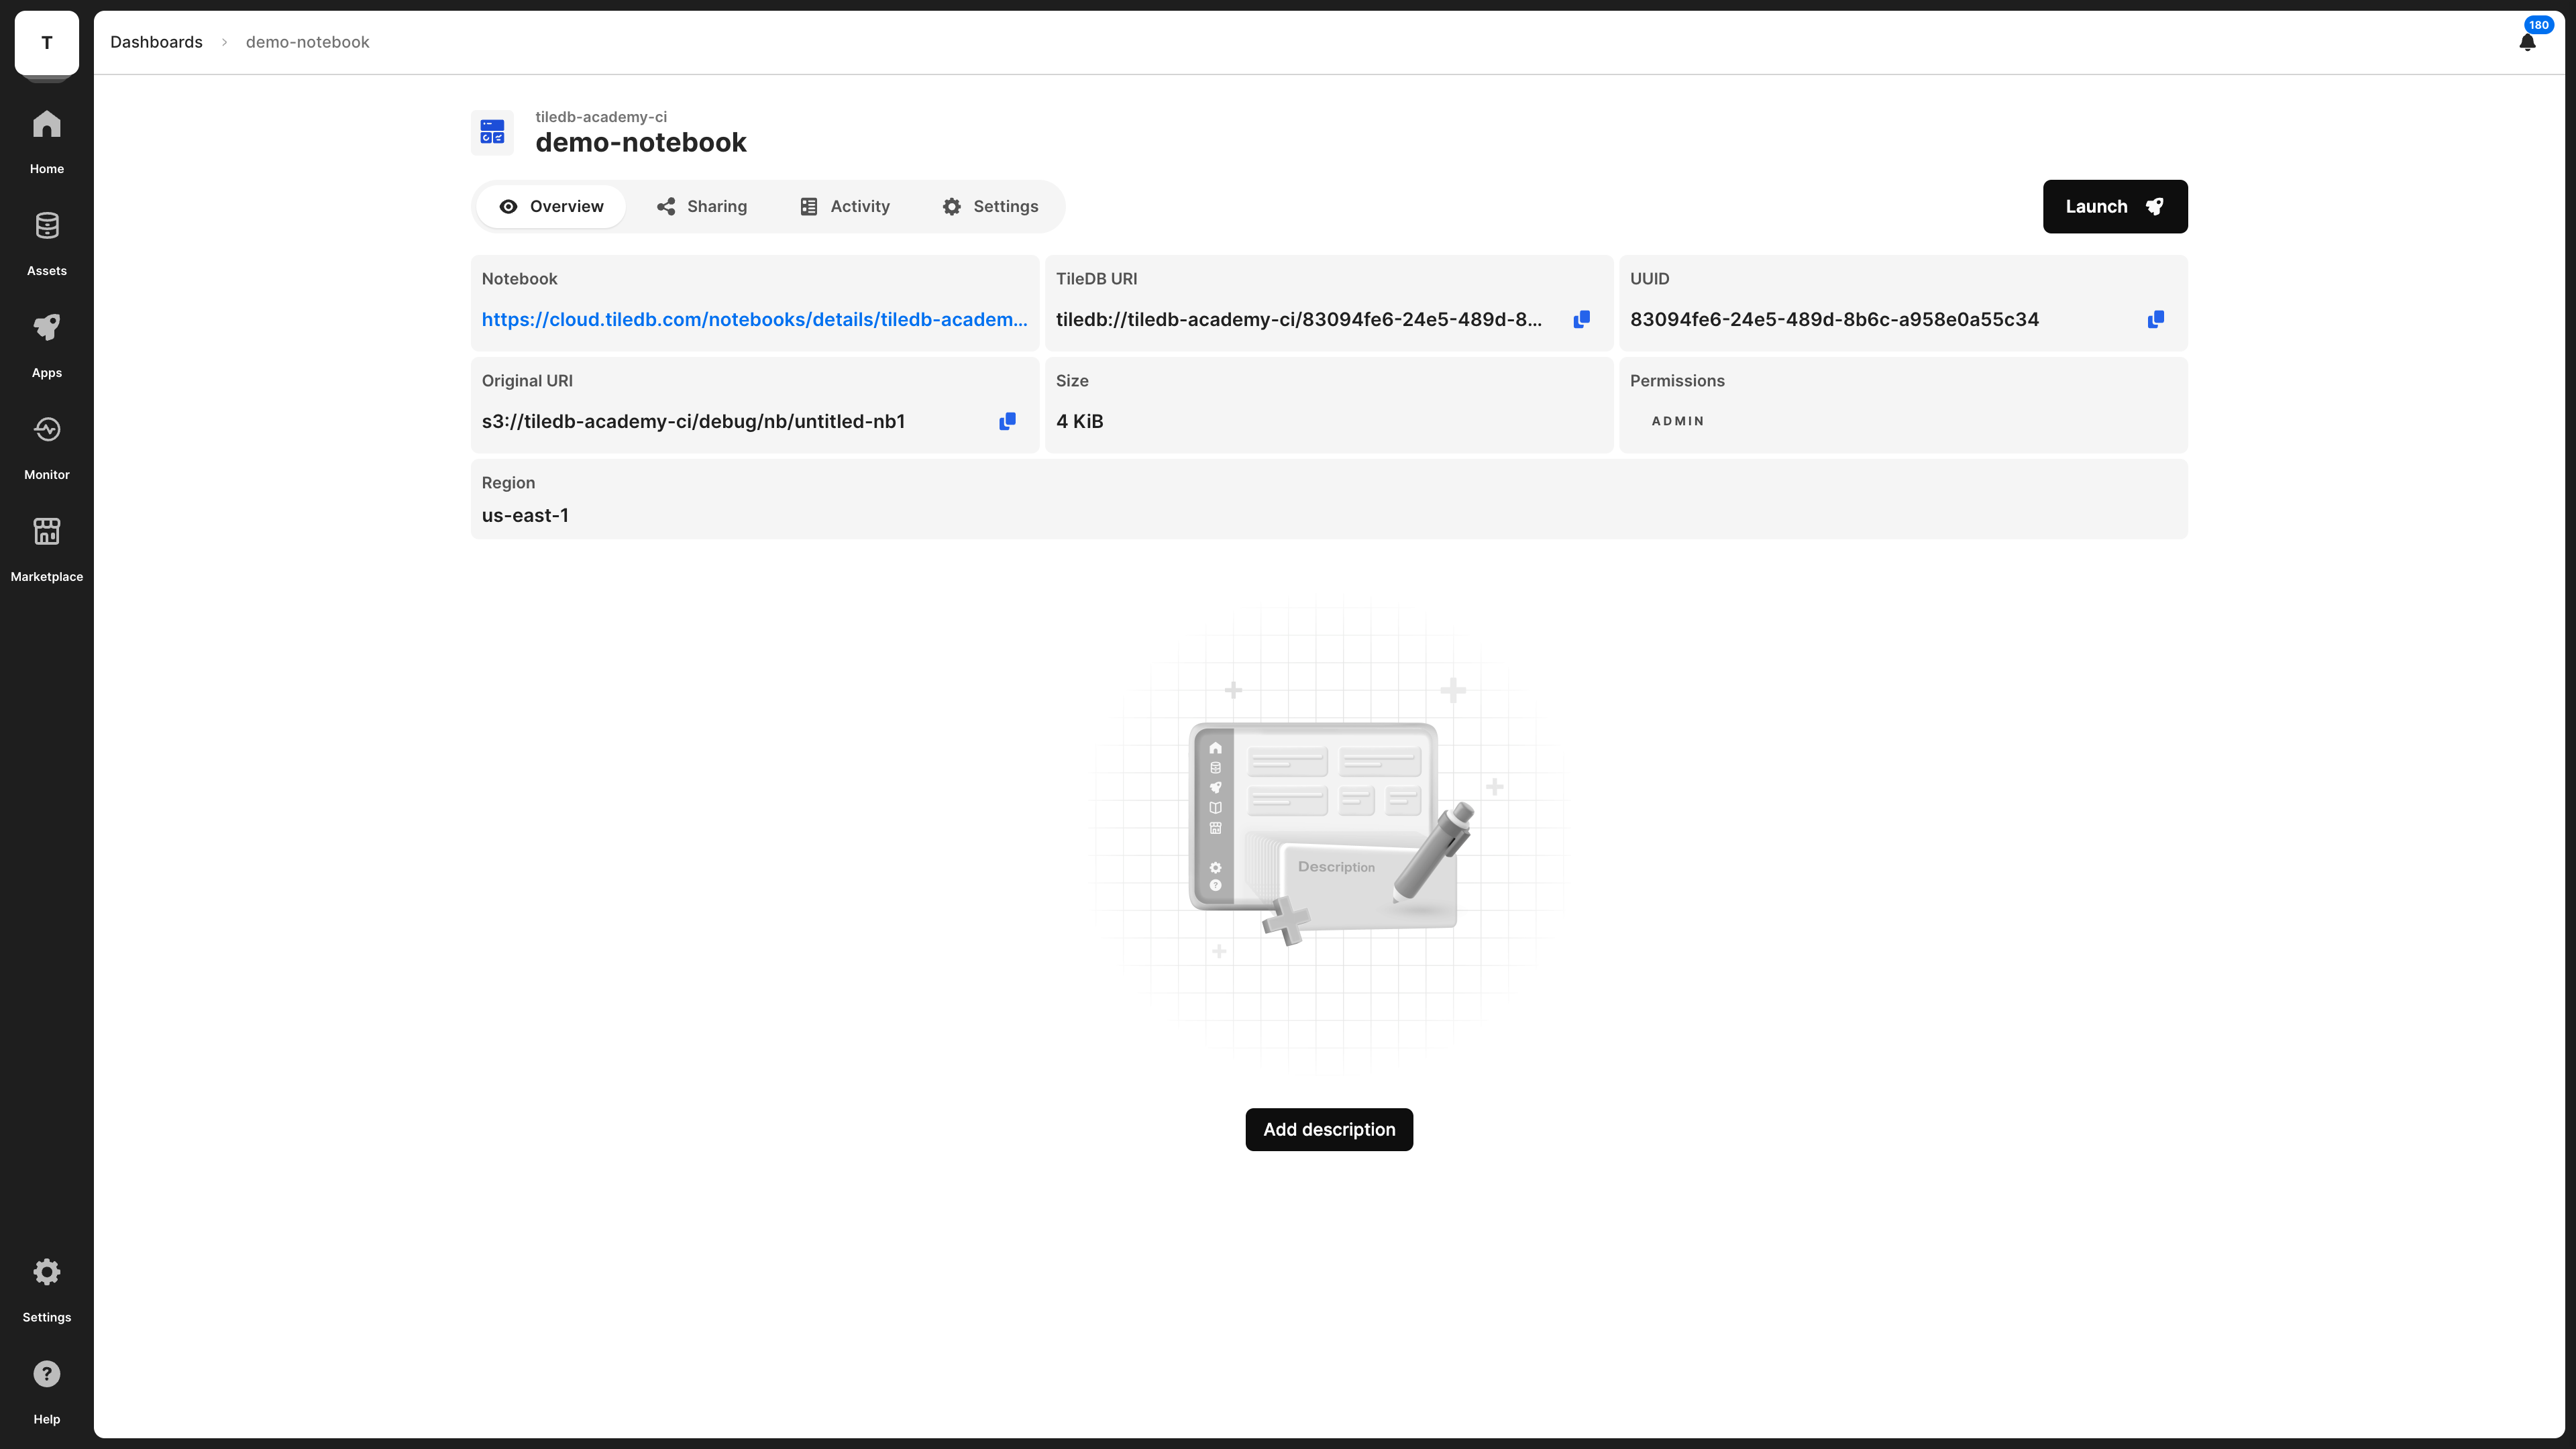
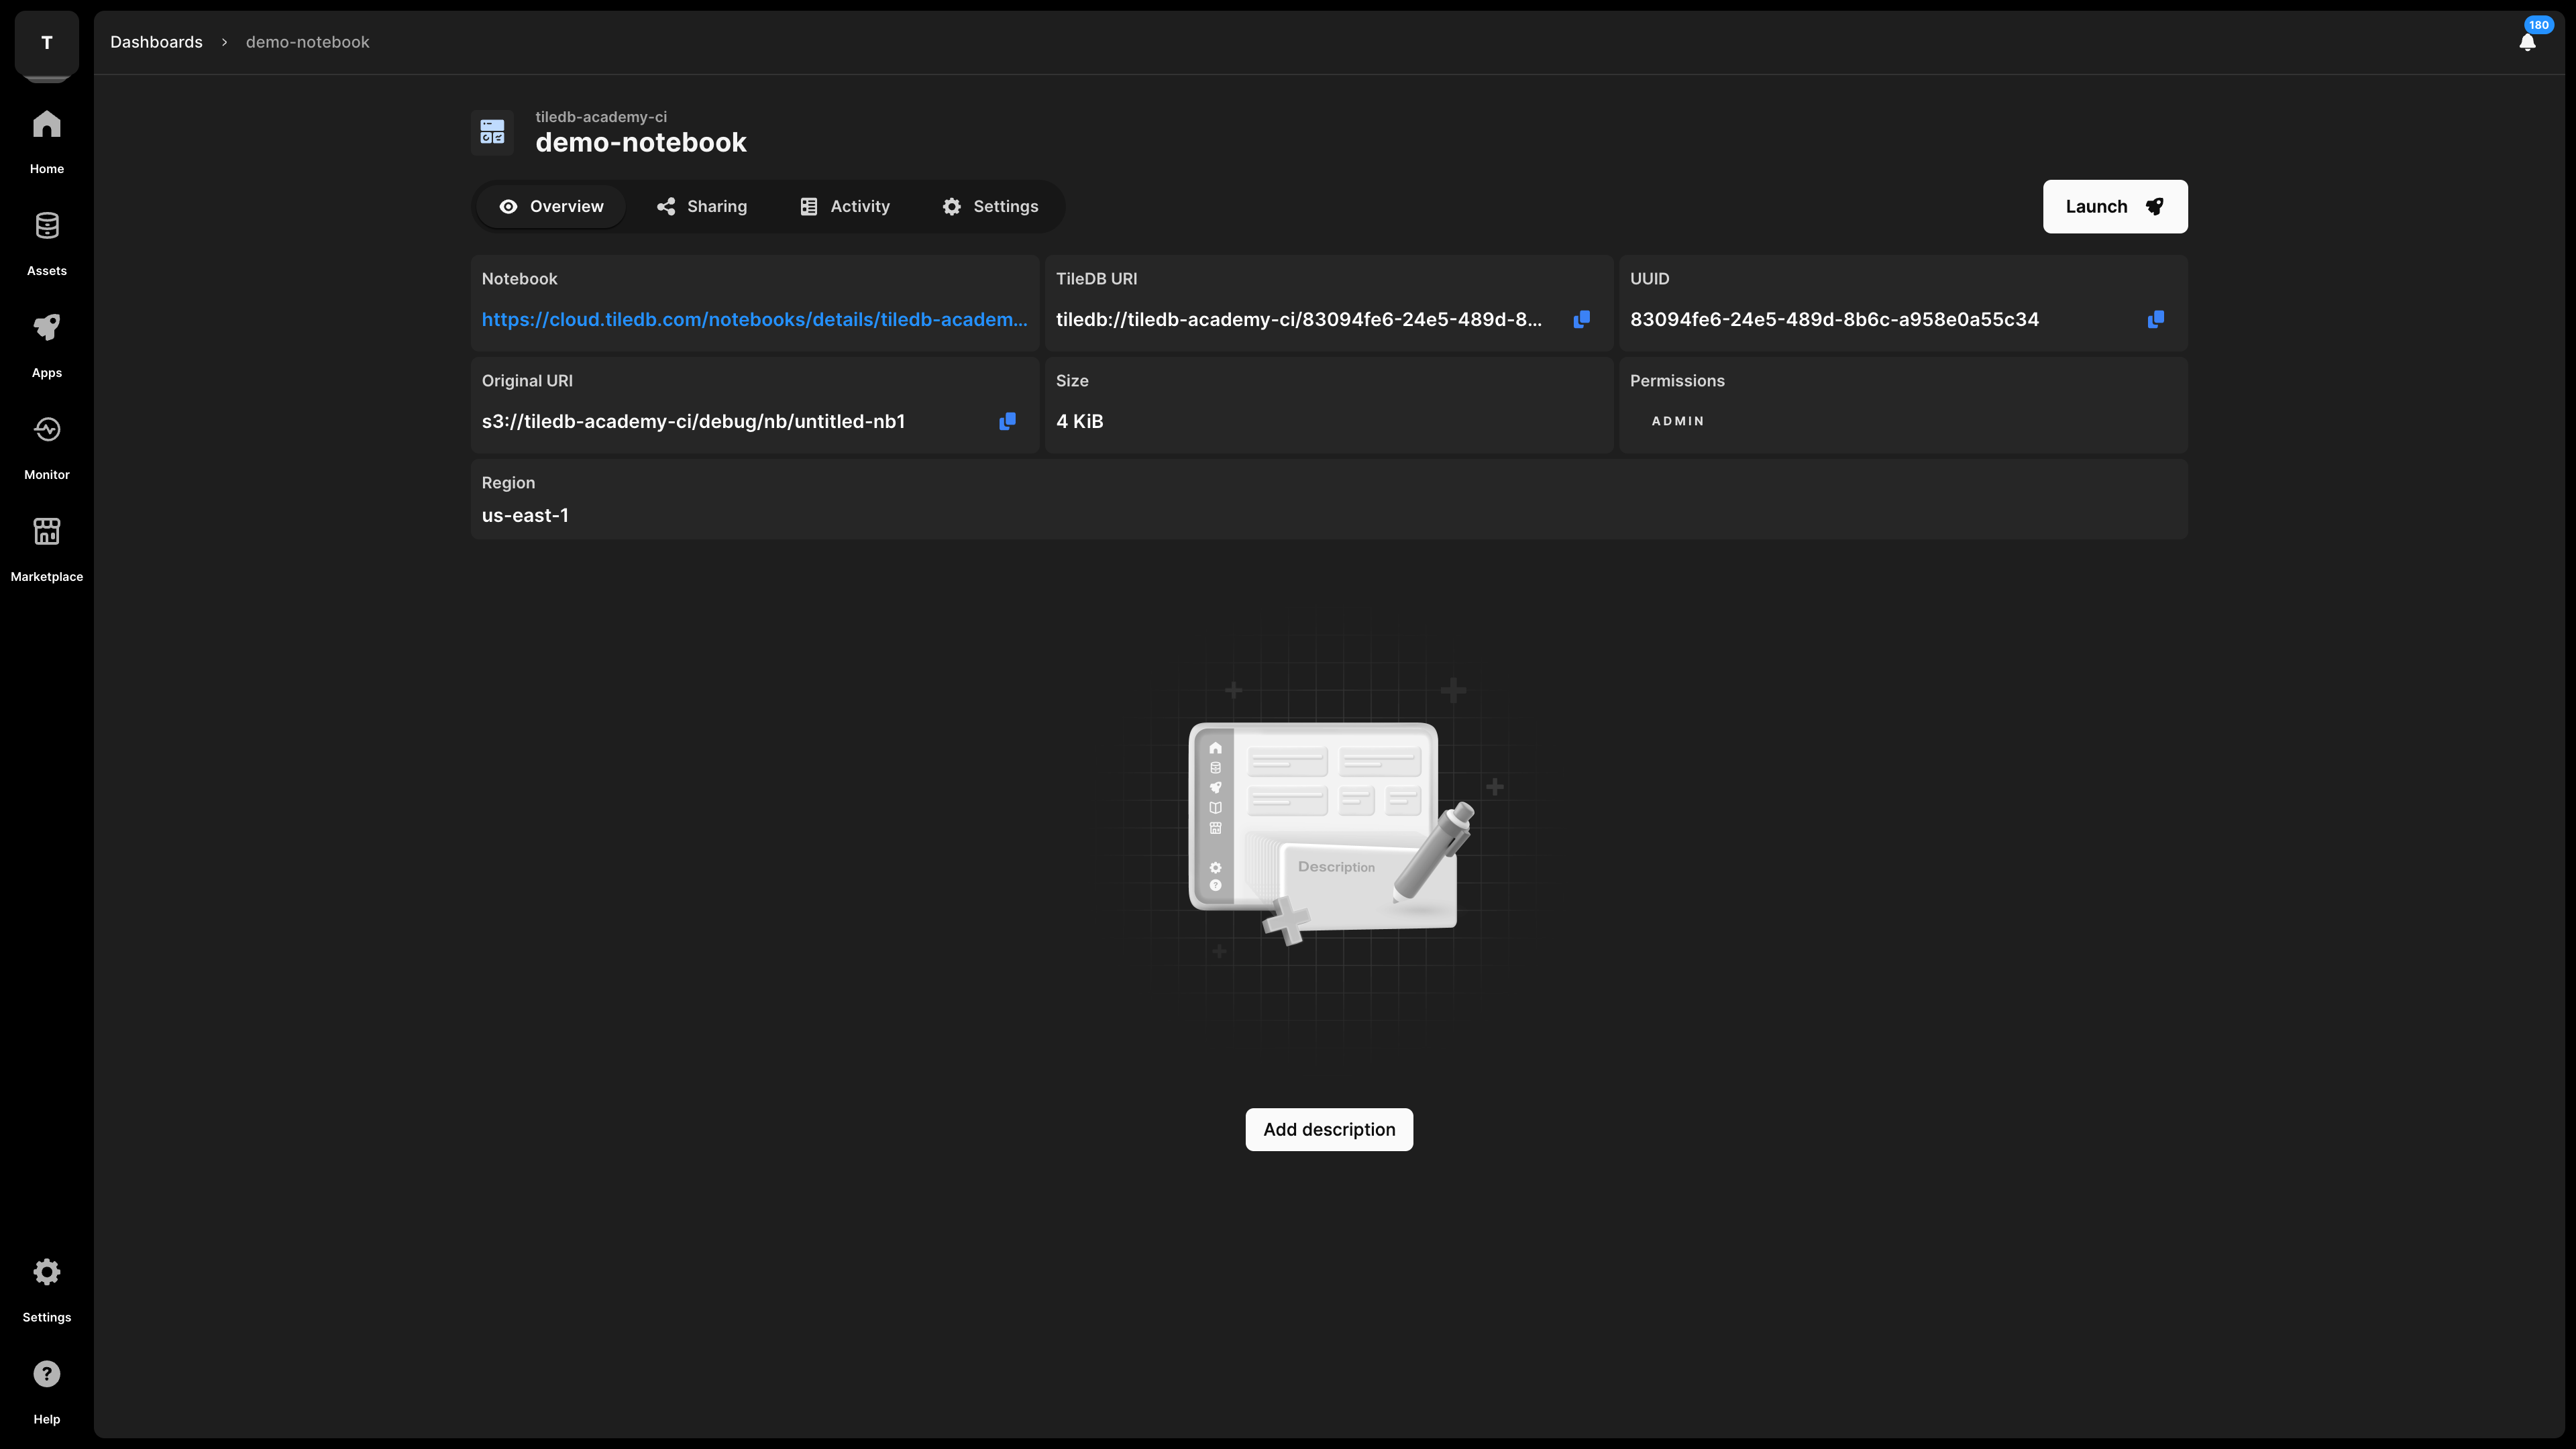
Edit an existing dashboard
After “Dashboard mode” is enabled for a notebook, the original notebook asset view within the TileDB Catalog is hidden, and replaced with the dashboard asset view. To edit the underlying notebook, a direct link to the notebook asset is provided on the dashboard’s Overview page. Select the link in the Notebook box to open the backing notebook for editing.